Performance Summaries
Get a weekly recap of key subscription metrics in your inbox
With Performance Summaries, you can subscribe to a weekly recap of your key subscriptions metrics (including how they changed vs. the prior week) delivered right to your inbox every Monday morning.
How can I subscribe to a weekly Performance Summary?
- Click on Account from the RevenueCat Dashboard
- Open the Notifications option where you'll see the Performance Summaries section
- Select the projects you want to include in your weekly Performance Summary, and click Update to save your changes
📘Verify your email address
You must first verify your email address with us in order to receive Performance Summaries.
What will be included in my Performance Summary?
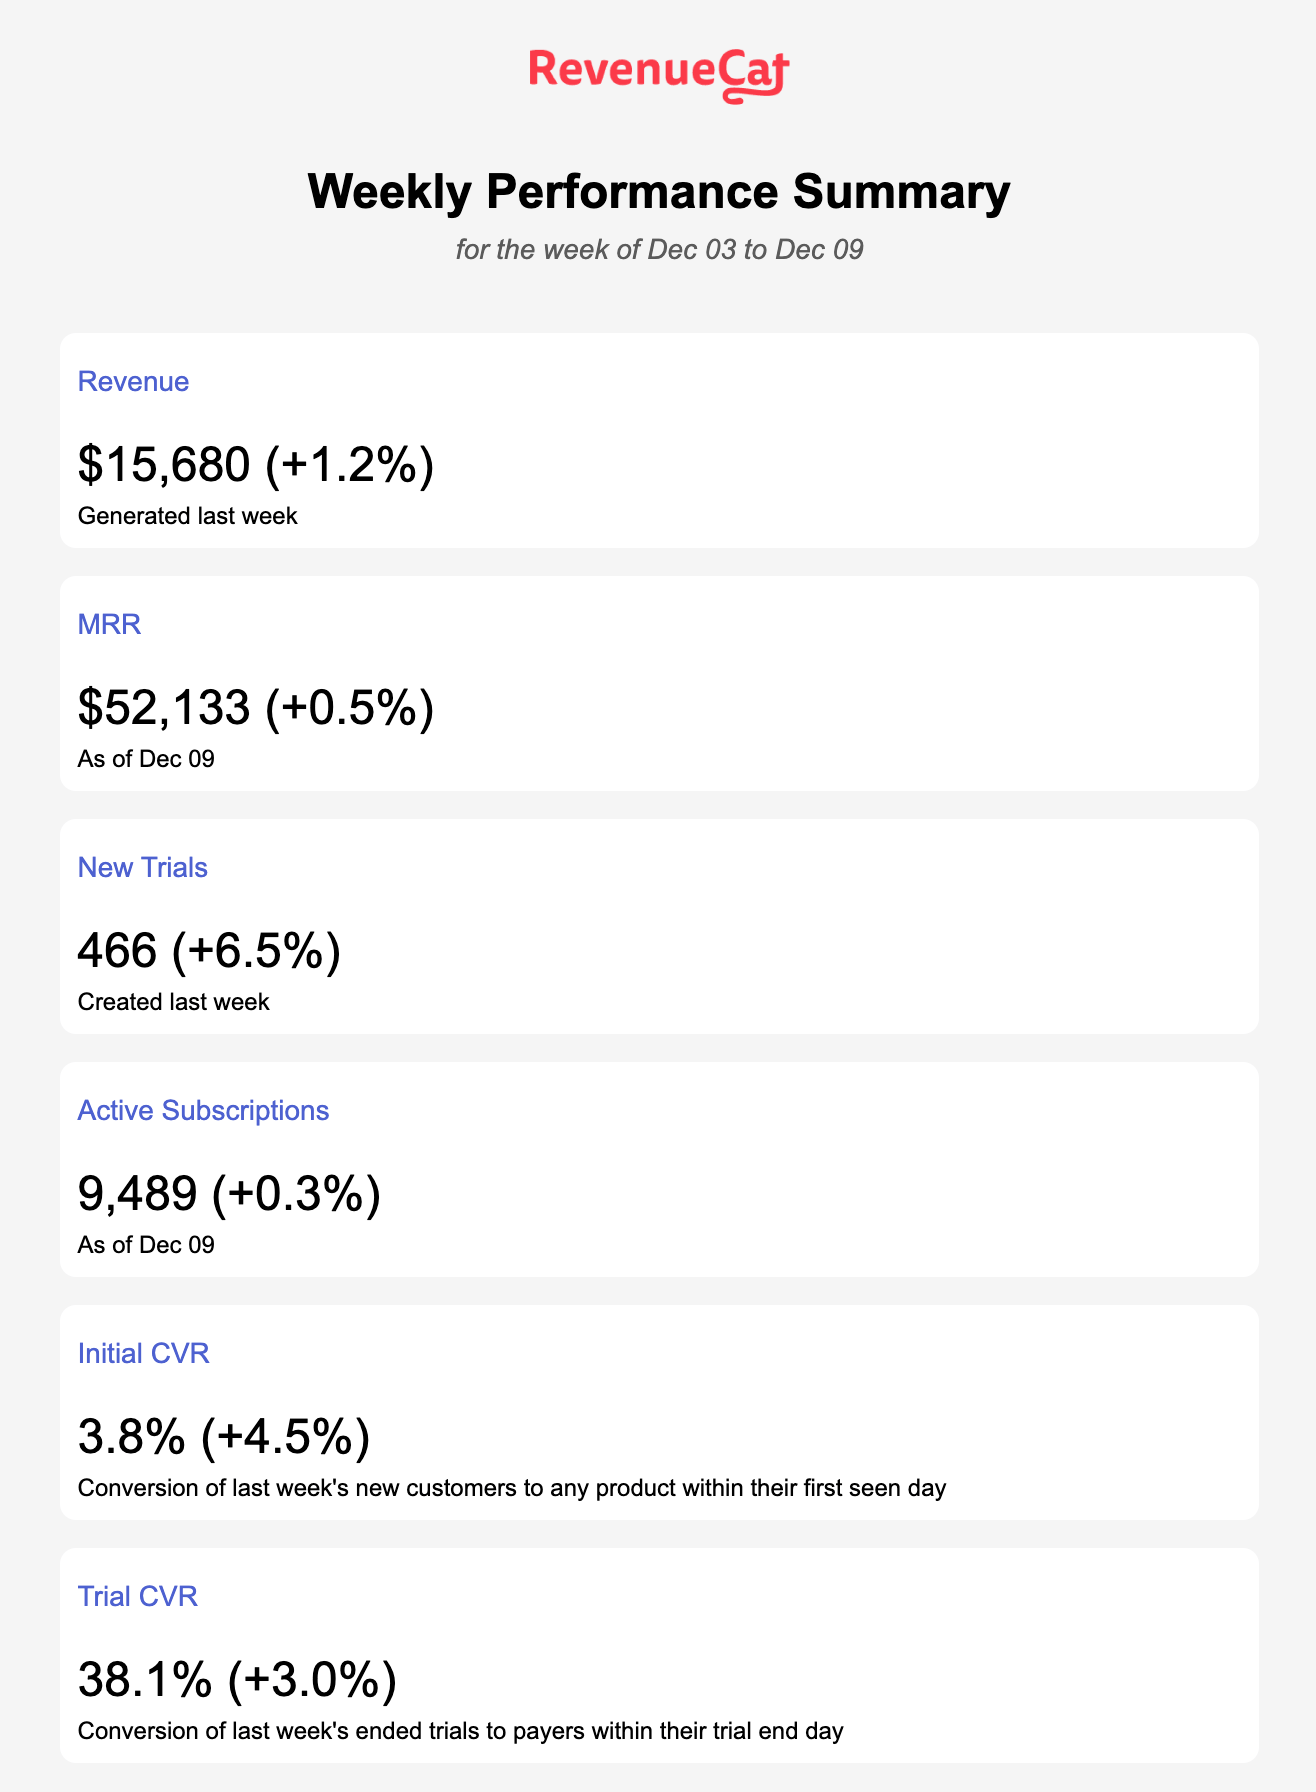
Your weekly performance summary will include the following metrics, aggregated for all Projects that you've subscribed to the email for.
| Metric | Definition |
|---|---|
| Revenue | Total revenue generated in the last week, minus any of those transactions that have been refunded. Learn more about how Revenue is calculated |
| MRR | Total MRR as of the end of the last week. Learn more about how MRR is calculated |
| New Trials | The count of Trials started in the last week. |
| Active Subscriptions | The count of Active Subscriptions as of the end of the last week. Learn more about how Active Subscriptions are calculated |
| Initial CVR | The conversion rate of last week's new customers to any product (whether a subscription or other IAP) within their first seen day. This is equivalent to the Day 0 Conversion Timeframe in Charts. Learn more about Conversion Timeframes |
| Trial CVR | The conversion rate of last week's ended trials to payers within their trial end day. (NOTE: This definition differs from our Trial Conversion chart to make sure we're providing complete, applicable data for the current week to compare against the prior week. Learn more about why below.) |
FAQs
| Question | Answer |
|---|---|
| How is a "week" defined in these summaries? | Just like in Charts, we measure a week as beginning on Sunday and ending the following Saturday. |
| When will the summary be emailed to me? | Performance Summaries are delivered every Monday at 8AM ET. |
| Why are the conversion rate metrics limited to conversions occurring on a first seen day or trial end day? | Since we're delivering this weekly performance summary just one day after the week has ended, we need to ensure that all data points are complete to be accurately compared week over week, and a longer conversion timeframe could result in some days of the week being complete while others are incomplete, skewing the data. |
| Why does the Trial Conversion Rate definition differ from Charts? | In order to provide a comparable week over week measurement of Trial Conversion Rate, we're cohorting trials by their end day (the final day of the trial), since their end day is what creates the conversion opportunity that we can track and provide as a weekly performance metric with a tight conversion timeframe (described above). Keep in mind that since this definition is divorced from when the customer's journey began, or even when they started their trial (if you offer different trial lengths), if you see an unexpected change in performance we encourage you to visit the Trial Conversion & Active Trials Movement charts to analyze the data and see what may be driving the change. |
| Can I subscribe to individual Performance Summaries for each project? | Not at this time, but it's something we're considering for the future! If that's a feature you need, let us know about it. |
Why are some metrics empty with just a -? | The hyphen indicates an empty data point, which may occur for reasons like: - There are 0 trials completed (so trial conversion can not be calculated) - There are 0 installs (so initial conversion can not be calculated) - Last week's value is zero so the % change can not be calculated If you believe this to be in error, feel free to reach out through Support. |
Was this page helpful?