Experiments Results



The Results page gives you a real-time, high-level overview of performance and lets you explore key metrics in detail. Results are organized across three tabs.
Enrollment and notes
At the top of the Results page, you'll see the experiment's enrollment criteria and any notes you've added. This keeps context visible as you review the data. You can update your notes directly on the page as you analyze results.

Results summary
The Results summary tab shows your primary and secondary metrics, the ones selected when setting up the experiment. This is the best place to start analyzing performance across all variants.
For multivariate experiments (3-4 variants), you'll see results for all treatment variants compared against the control, helping you identify the best-performing option.
Chart and table views
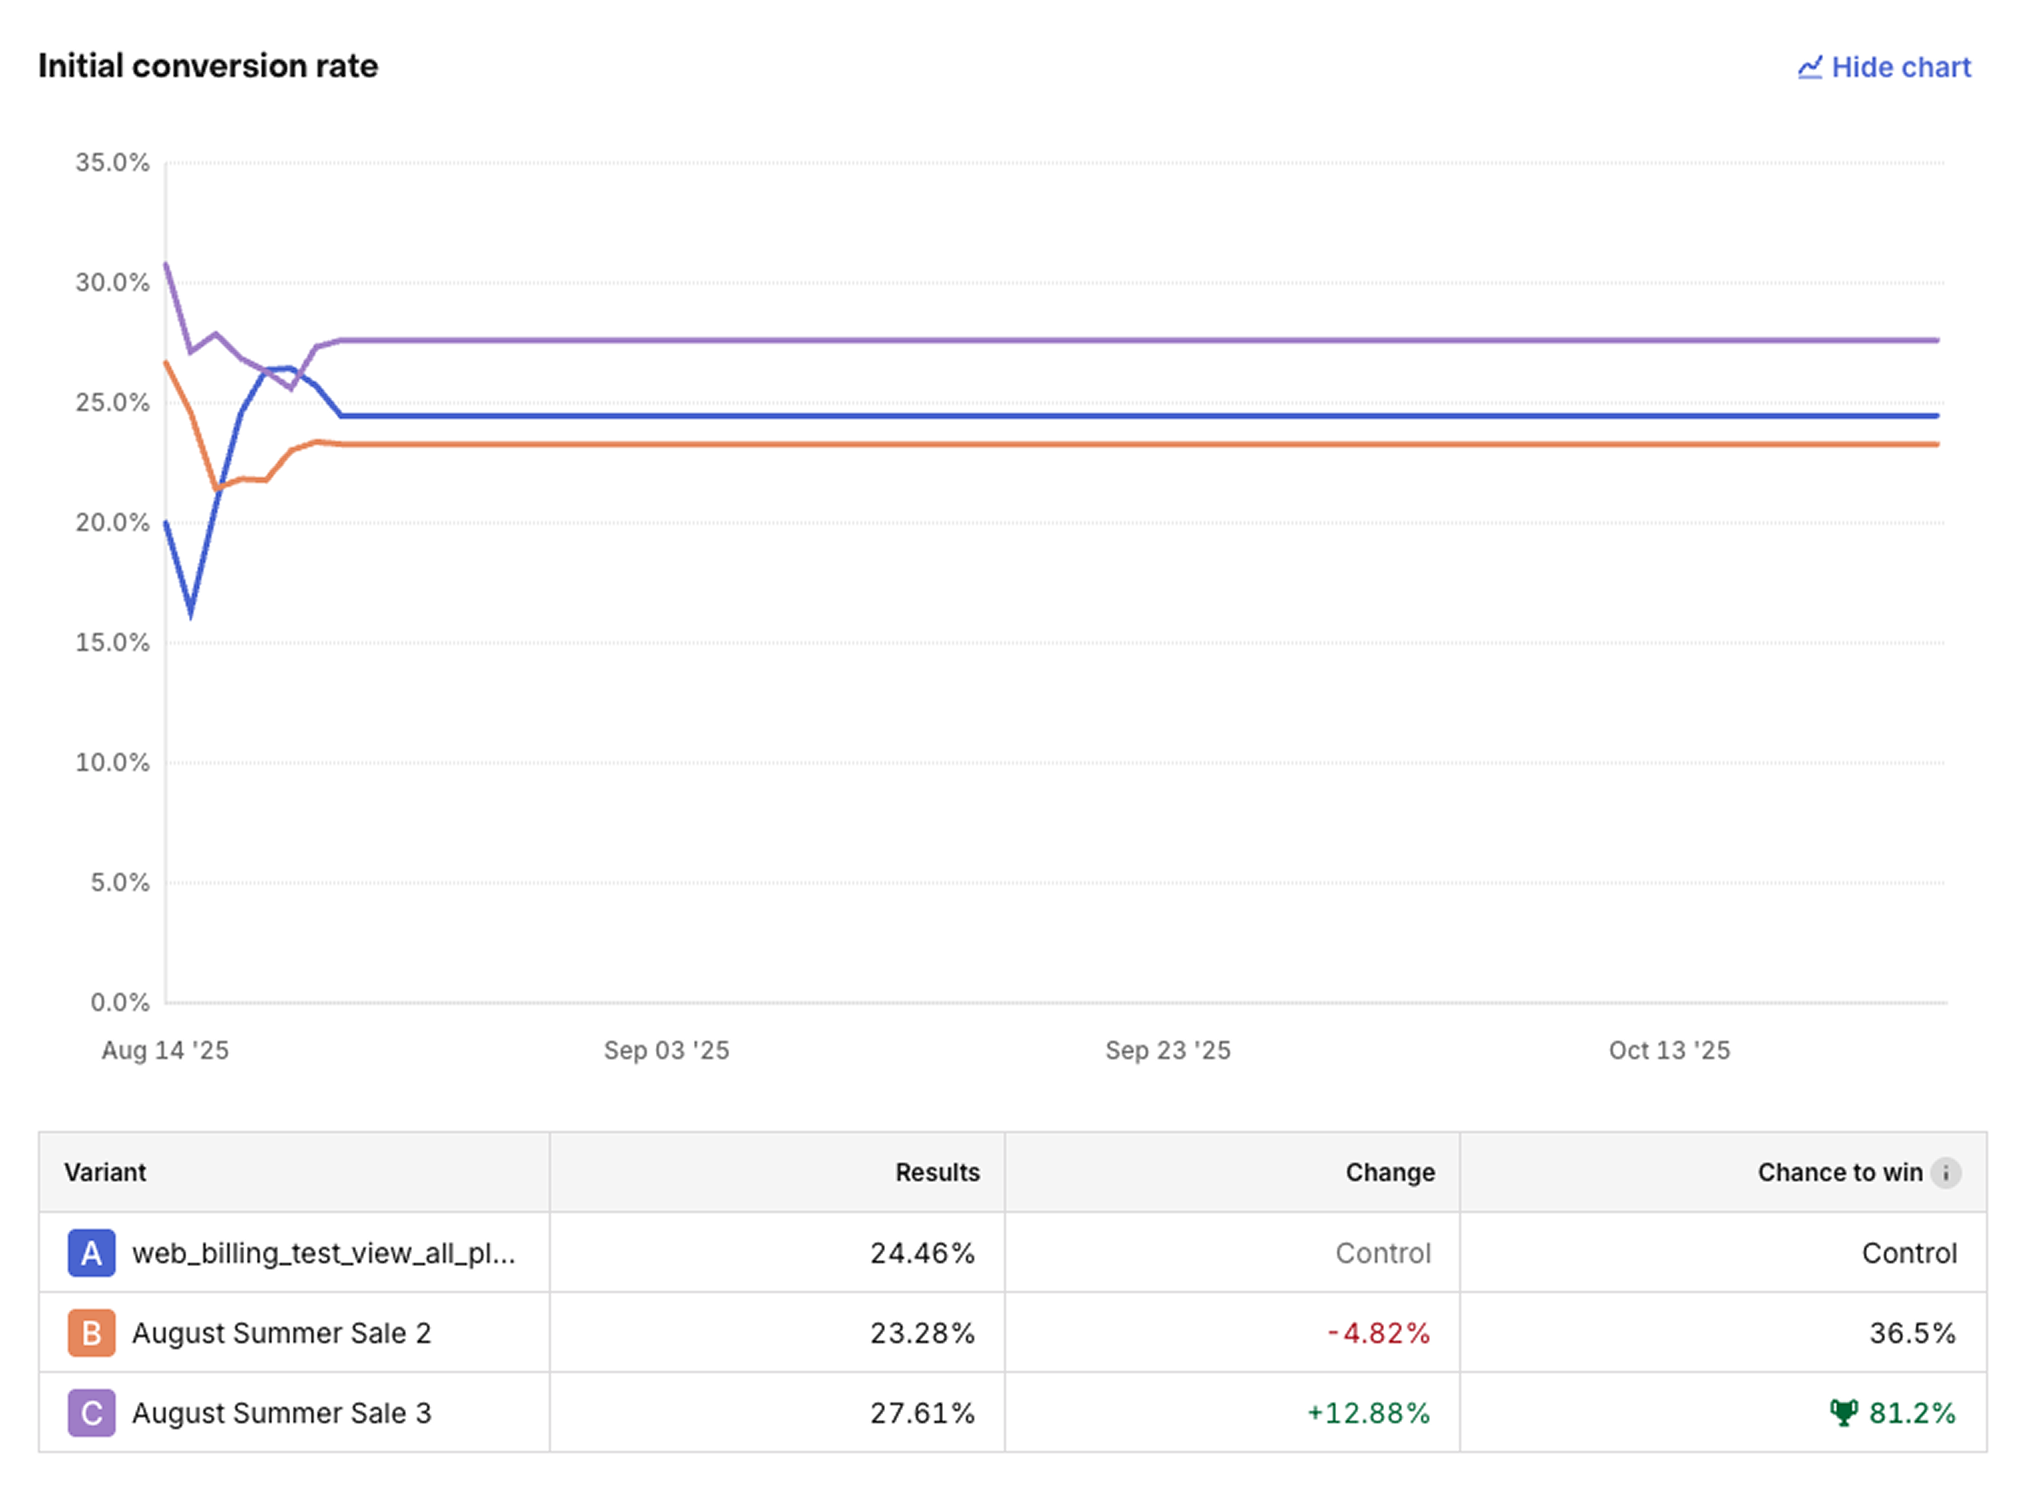
You will first see the primary metric results, with a chart showing the accumulated results for the lifetime of your experiment and a table with the total values. Following this, your secondary metrics will be presented in their respective sections. For each of these metrics you can also display a chart.
Product breakdown and filters
You can analyze most metrics by product as well. Click on the caret next to the variant name to see the metric broken down by the individual products in your experiment.
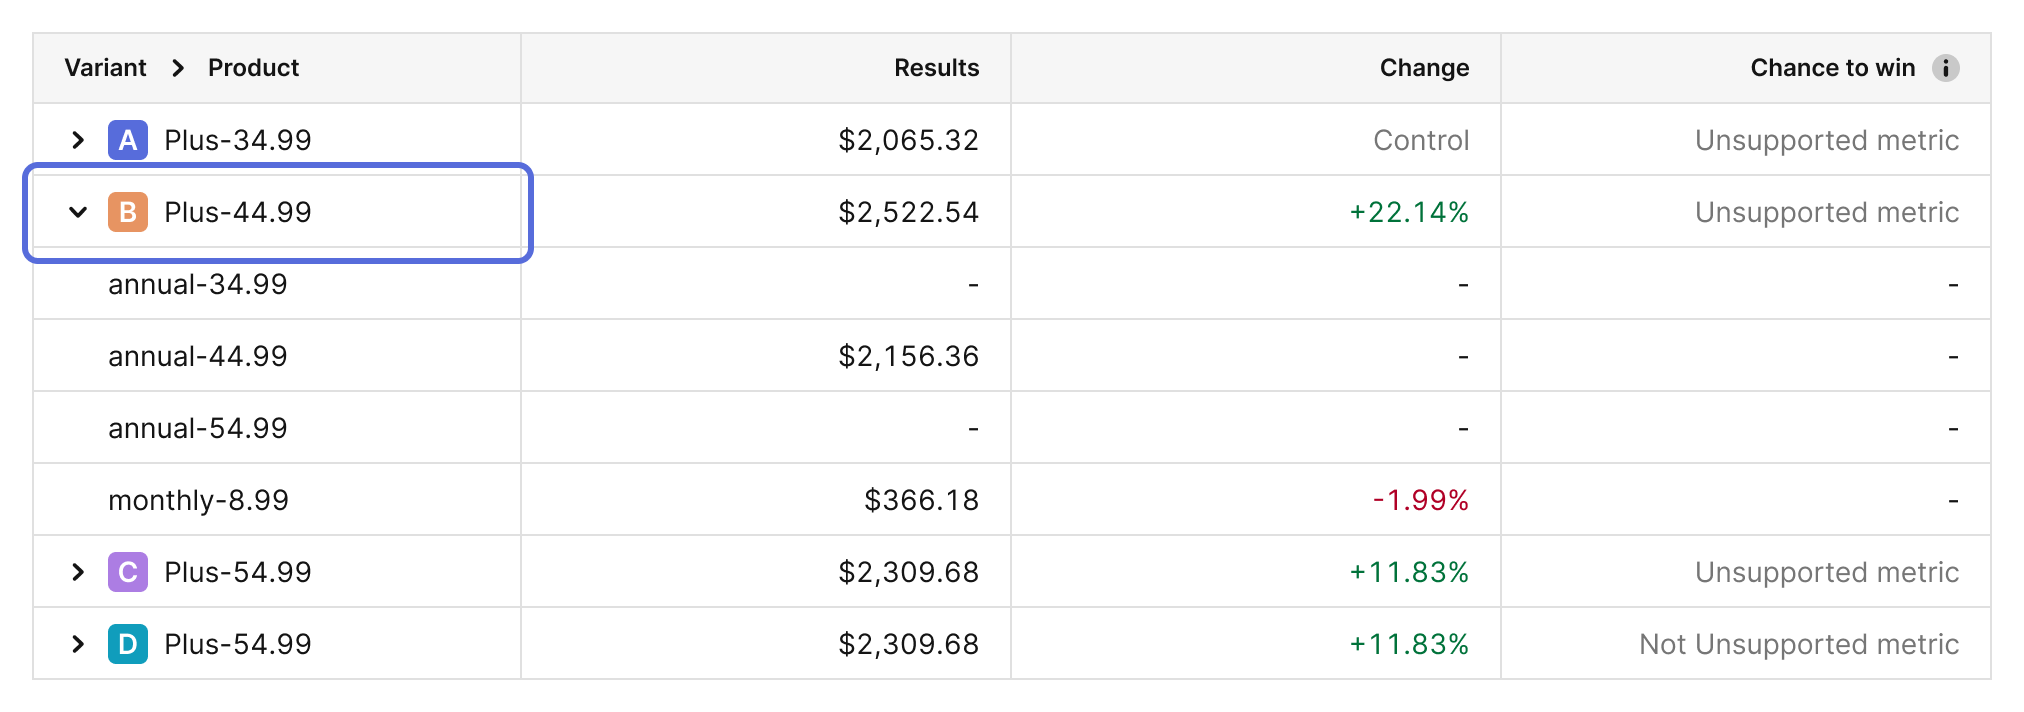
This product-level breakdown is available for both the primary and secondary metrics, and helps you understand:
- Which specific products are driving changes in performance
- How different subscription durations (e.g., monthly vs. yearly) compare within the same variant
- Whether certain products are significantly outperforming or underperforming within a variant
For example, a more prominent yearly subscription may decrease initial conversion rate relative to a more prominent monthly option, but those fewer conversions may produce more Realized LTV per paying customer. The product breakdown helps you identify these trade-offs.
To analyze results of a specific country or platform, use the filters to display only your selected segment.
Paywall view filter
Use the Paywall view filter to focus your results on the customers who actually saw a paywall.
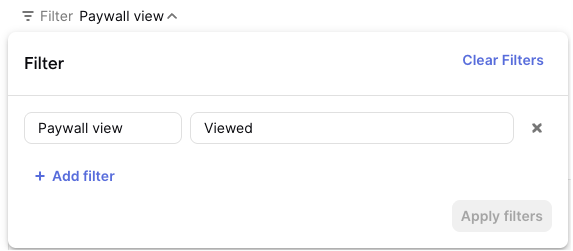
When a customer is enrolled in an experiment, they are assigned a variant, but they may not visit a paywall during the experiment window. Including customers who never saw one can dilute the measured effect of your test.
The filter has two values:
| Value | Description |
|---|---|
| Viewed | Customers who are enrolled and have seen a paywall for their assigned variant. |
| Not viewed | Customers who are enrolled but haven't yet seen a paywall. |
Removing the filter shows results for every enrolled customer, whether or not they saw a paywall.
For experiments that enroll new and existing customers, the filter is automatically set to Viewed when you first open the results. Experiments that enroll only new customers show all enrolled customers until you apply the filter.
For custom paywalls, a paywall view is recorded when your app calls trackCustomPaywallImpression. See Tracking Custom Paywall Impressions for setup instructions and supported SDK versions.
If you're using RevenueCat Paywalls, paywall views are tracked automatically — no additional code is needed.
If you don't call trackCustomPaywallImpression for your custom paywall, RevenueCat has no record of those paywall views. Those customers are counted under Not viewed even though they saw your paywall, so filtering by Viewed leaves them out of your results.
Required SDK versions
Tracking paywall views requires supported RevenueCat SDK versions. Customers using older SDK versions can't report paywall views. See Tracking Custom Paywall Impressions for the supported versions and Required SDK versions for existing customer experiments for enrollment requirements.
Results are computed in real time, using the most recent data each time you load the page. While an experiment is running or paused, the Results page shows a Real time data label; hover over it to see when the data was last fetched, and reload the page for the latest numbers. Once an experiment is stopped, this label is replaced by its start and end dates, since a stopped experiment's results reflect a fixed window.
If you're not seeing any data or are seeing unexpected results:
- Ensure each product that is a part of the experiment has been purchased at least once
- If enrollment counts are lower than expected, check whether your backend creates customers via our REST API before the SDK. Customers created directly via the API aren't enrolled in experiments. See Customers created via the REST API.
When you stop an experiment, results continue to update for the next 400 days so Realized LTV can mature. Renewals from customers who enrolled while the experiment was running can still appear; new subscriptions and one-time purchases started after the stop aren't included. See Stopping an experiment.
Statistical confidence
RevenueCat gives you two simple signals to understand your results: Chance to Win shows how likely a variant is to beat the control, and credible intervals show the range where the true difference probably falls.
Chance to win
The Chance to win metric helps you understand if differences between variants are meaningful real improvements or due to chance. It's calculated based on the observed data and reflects the probability that a treatment variant is performing better than the control. For multivariate experiments, each treatment variant shows its individual chance to win against the control.
Example with 2 variants (A/B test): If your Treatment (Variant B) shows a 6.1% initial conversion rate vs 5.2% for your Control (Variant A) with a 98% Chance to Win, you can be confident this improvement is meaningful, not just random variation.
Example with 4 variants (multivariate):
- Variant A (Control): 5.2% initial conversion rate (baseline)
- Variant B: 6.1% conversion, 98% Chance to Win
- Variant C: 5.8% conversion, 75% Chance to Win
- Variant D: 5.0% conversion, 15% Chance to Win
In this case, Variant B shows a clear winner with high confidence, while Variant C shows promise but needs more data, and Variant D is likely underperforming.
Chance to win helps you make informed decisions about when to end your experiment. Many developers consider 95% Chance to Win sufficient to declare a winner, but the right threshold depends on what you're testing and your risk tolerance. For example, you may opt for a higher Chance to Win when deciding on a high-stakes change, such as whether to use in-app vs web purchases, than when deciding on a paywall copy change.
Credible intervals
A 95% credible interval shows the range where a variant's lift (relative to control) has a 95% probability of falling, given the observed data. While Chance to Win answers "is the difference real?", credible intervals answer "by how much did this variant move the metric?" — giving you a sense of the magnitude and direction of the effect.
Each non-control row in the results table shows a horizontal bar spanning the interval, with a dot marking the median (point estimate) and a dashed line at 0% marking no change:
- Green bar — the interval lies entirely above 0%, meaning the variant is very likely better than control.
- Red bar — the interval lies entirely below 0%, meaning the variant is very likely worse than control.
- Grey bar — the interval straddles 0%, meaning the direction is inconclusive.
Credible intervals appear at both the aggregate level and the per-product level — if you expand a metric row using the caret next to the variant name, each product row will show its own credible interval.
Both indicators are available for the following metrics:
- Initial conversion rate
- Trial conversion rate
- Conversion to paying
These calculations will appear in the Results summary once you've collected enough data to produce reliable results. Use them together to make confident decisions about when to end your experiment and declare a winner.
If the Realized LTV of your Treatment is performing meaningfully worse than your Control, we'll automatically email you to let you know about it so that you can run your test with confidence.
Full report
The Full report tab gives you a detailed view of all experiment metrics. Use it to compare variant performance beyond your primary and secondary metrics.
All experiment metrics are available in tables that show the performance of Variant A (the control) versus the results and change over control of each treatment variant in your experiment.
The customer journey for a subscription product can be complex: a "conversion" may only be the start of a trial, a single payment is only a portion of the total revenue that subscription may eventually generate, and other events like refunds and cancellations are critical to understanding how a cohort is likely to monetize over time.
To help parse your results, we've broken up metrics into three tables:
-
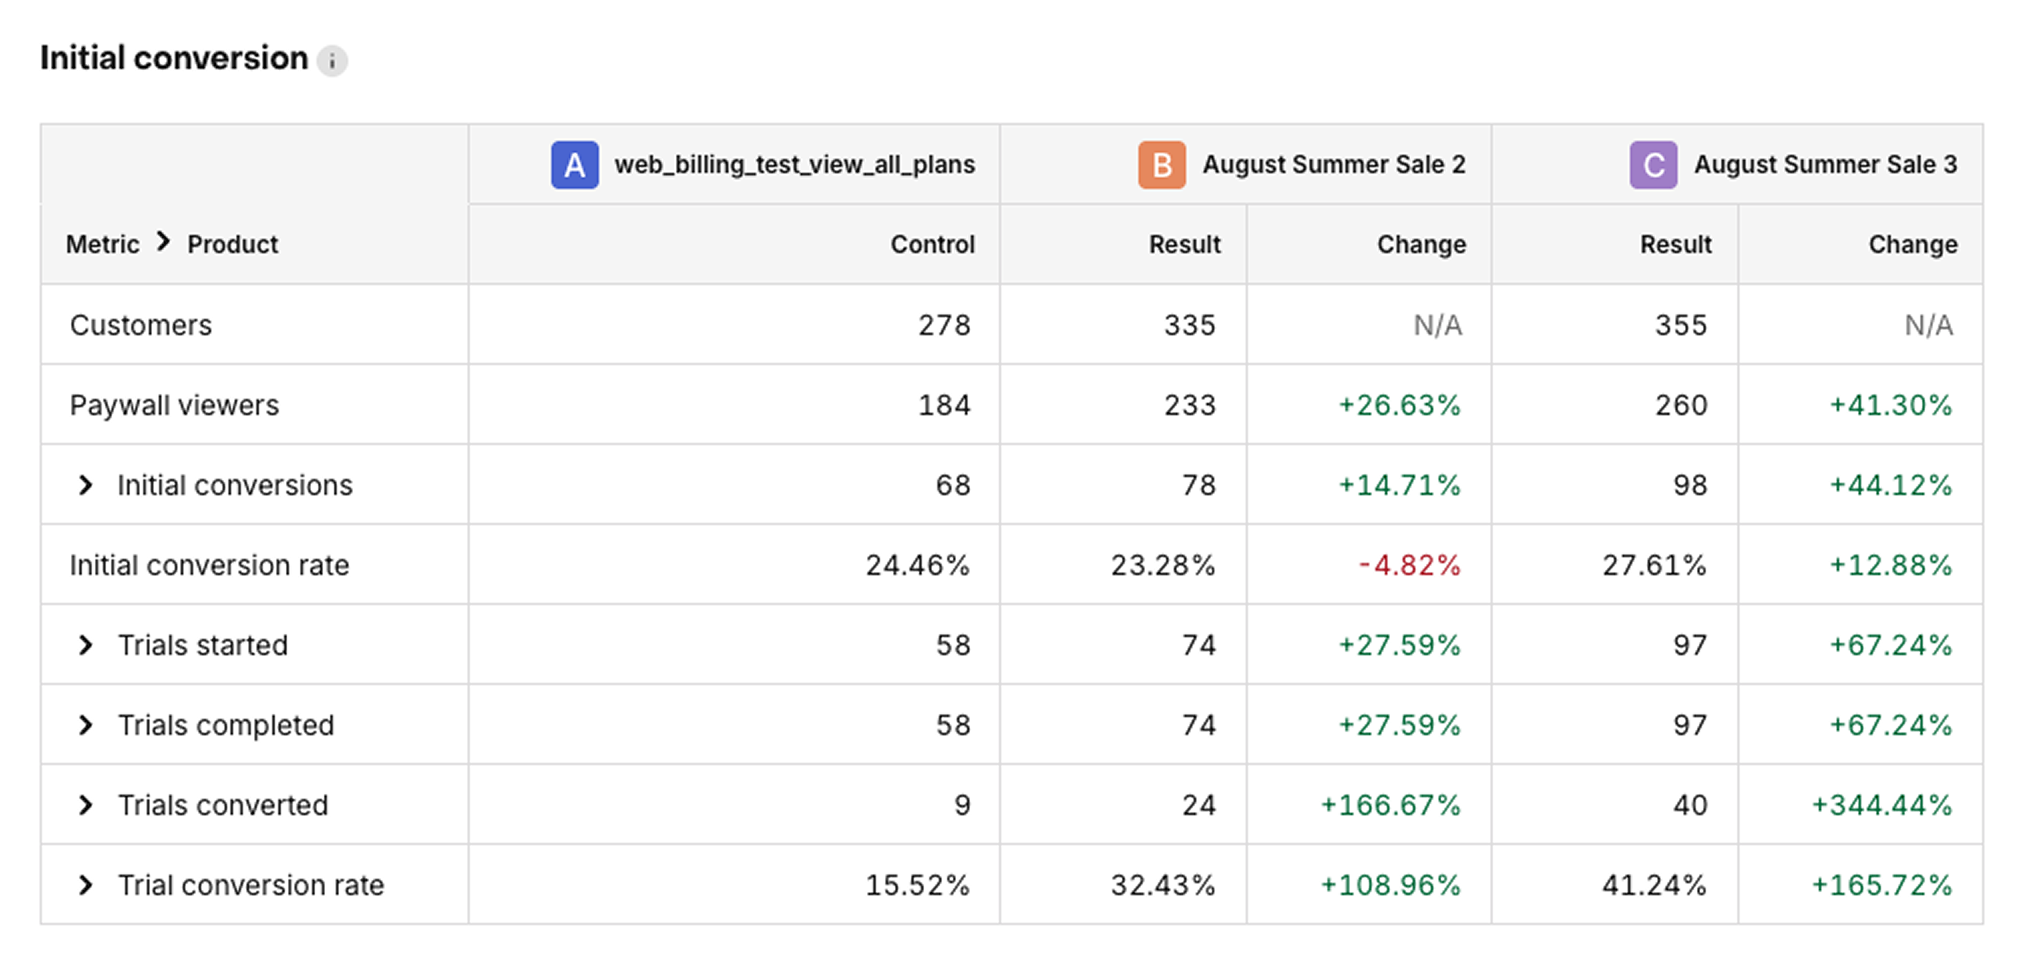
Initial conversion: For understanding how these key early conversion rates have been influenced by your test. These metrics are frequently the strongest predictors of LTV changes in an experiment.
-
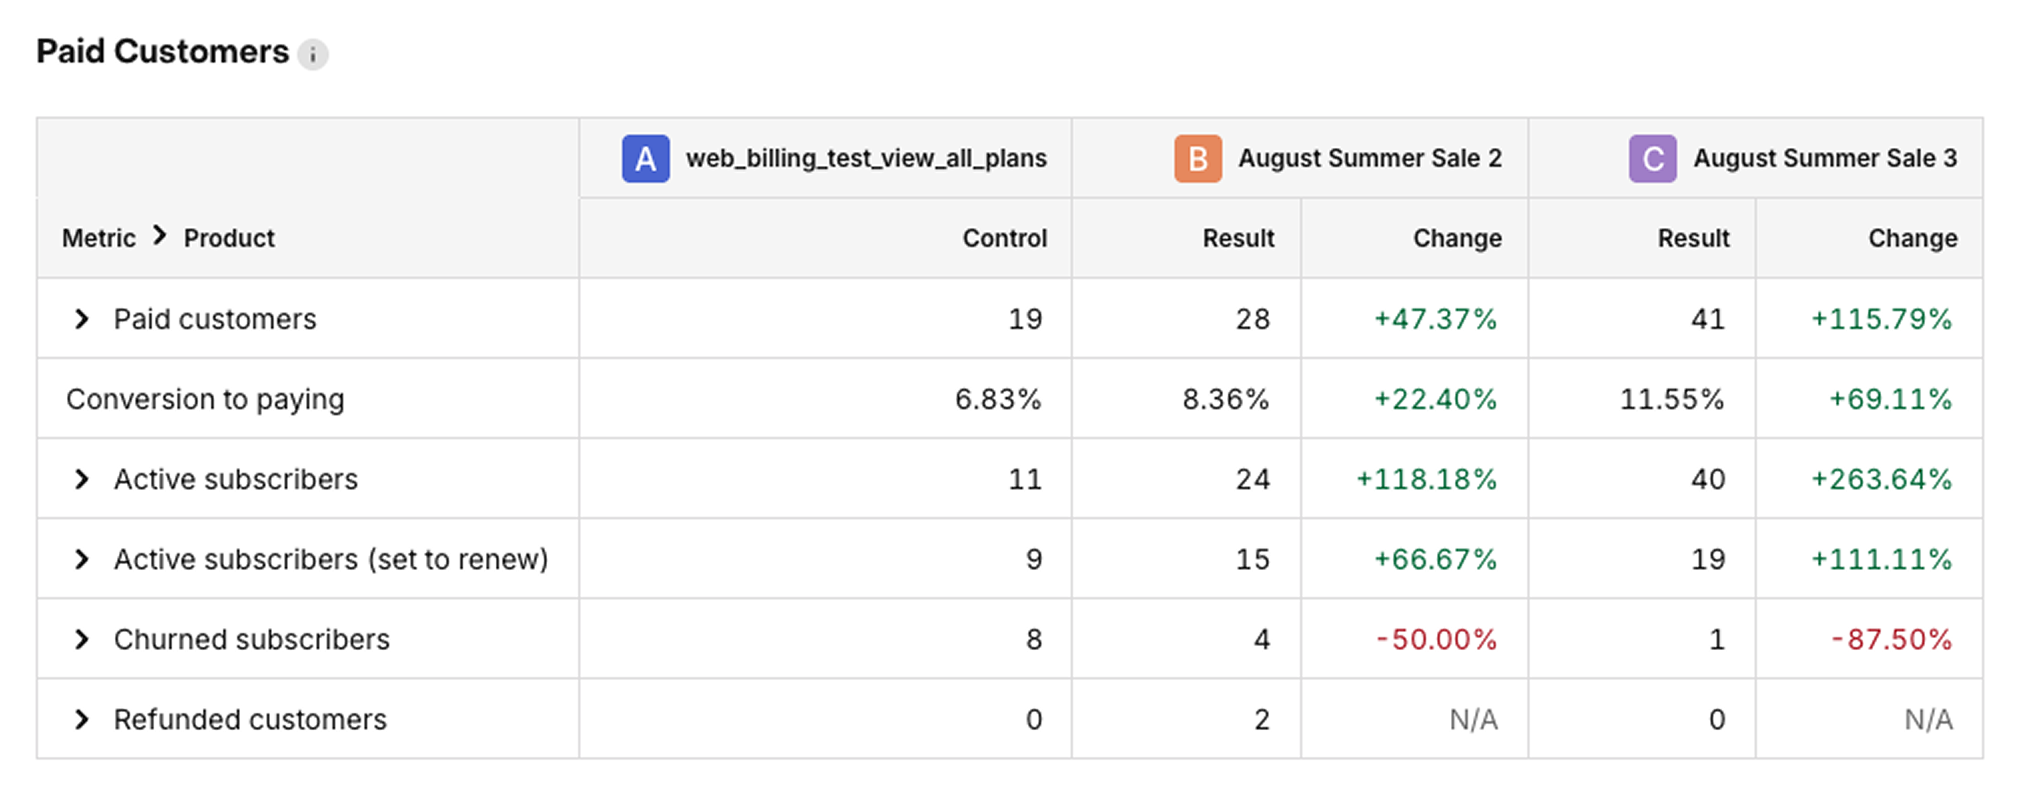
Paid customers: For understanding how your initial conversion trends are translating into new paying customers.
-
Revenue: For understanding how those two sets of changes interact with each other to yield overall impact to your business.
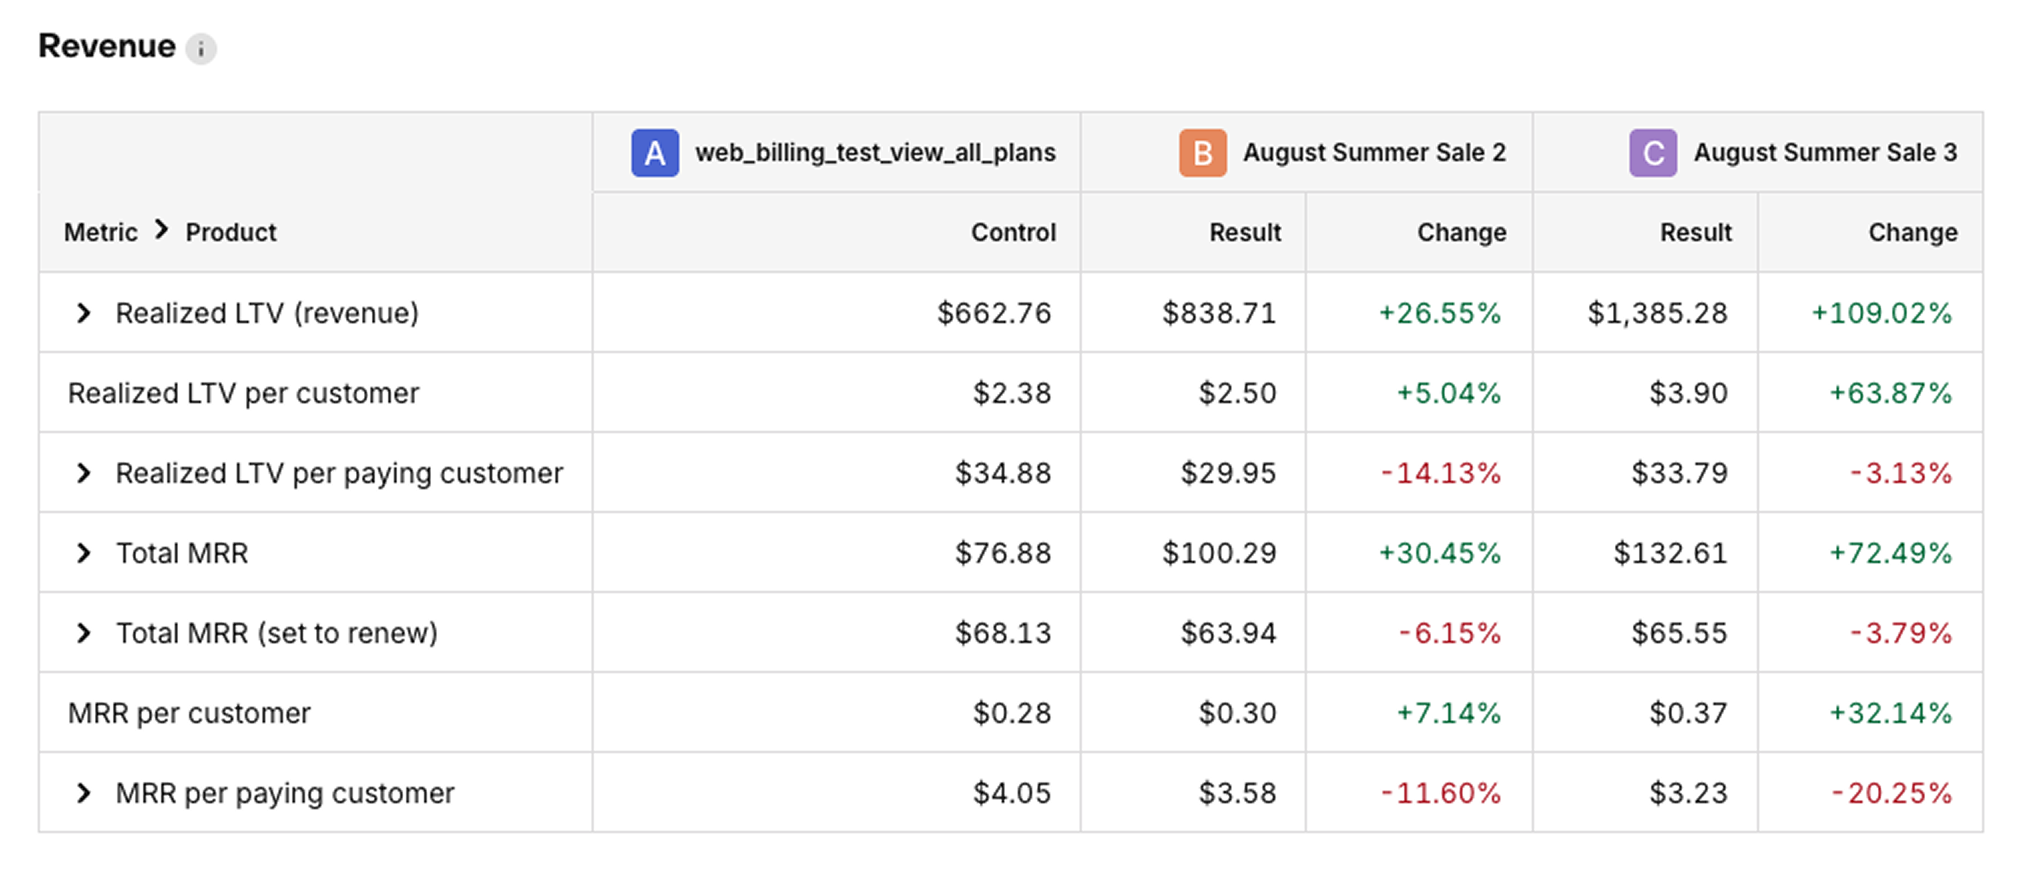
Similar to the Results summary, you can also see a breakdown of the products performance for each metric by clicking on the caret next to the metric name.
There is also an option to visualize the cumulative results of a selected metric in a daily chart. To display the chart, click Show chart at the top of the tab section. You can then click Export chart CSV to receive an export of all metrics by day for deeper analysis.
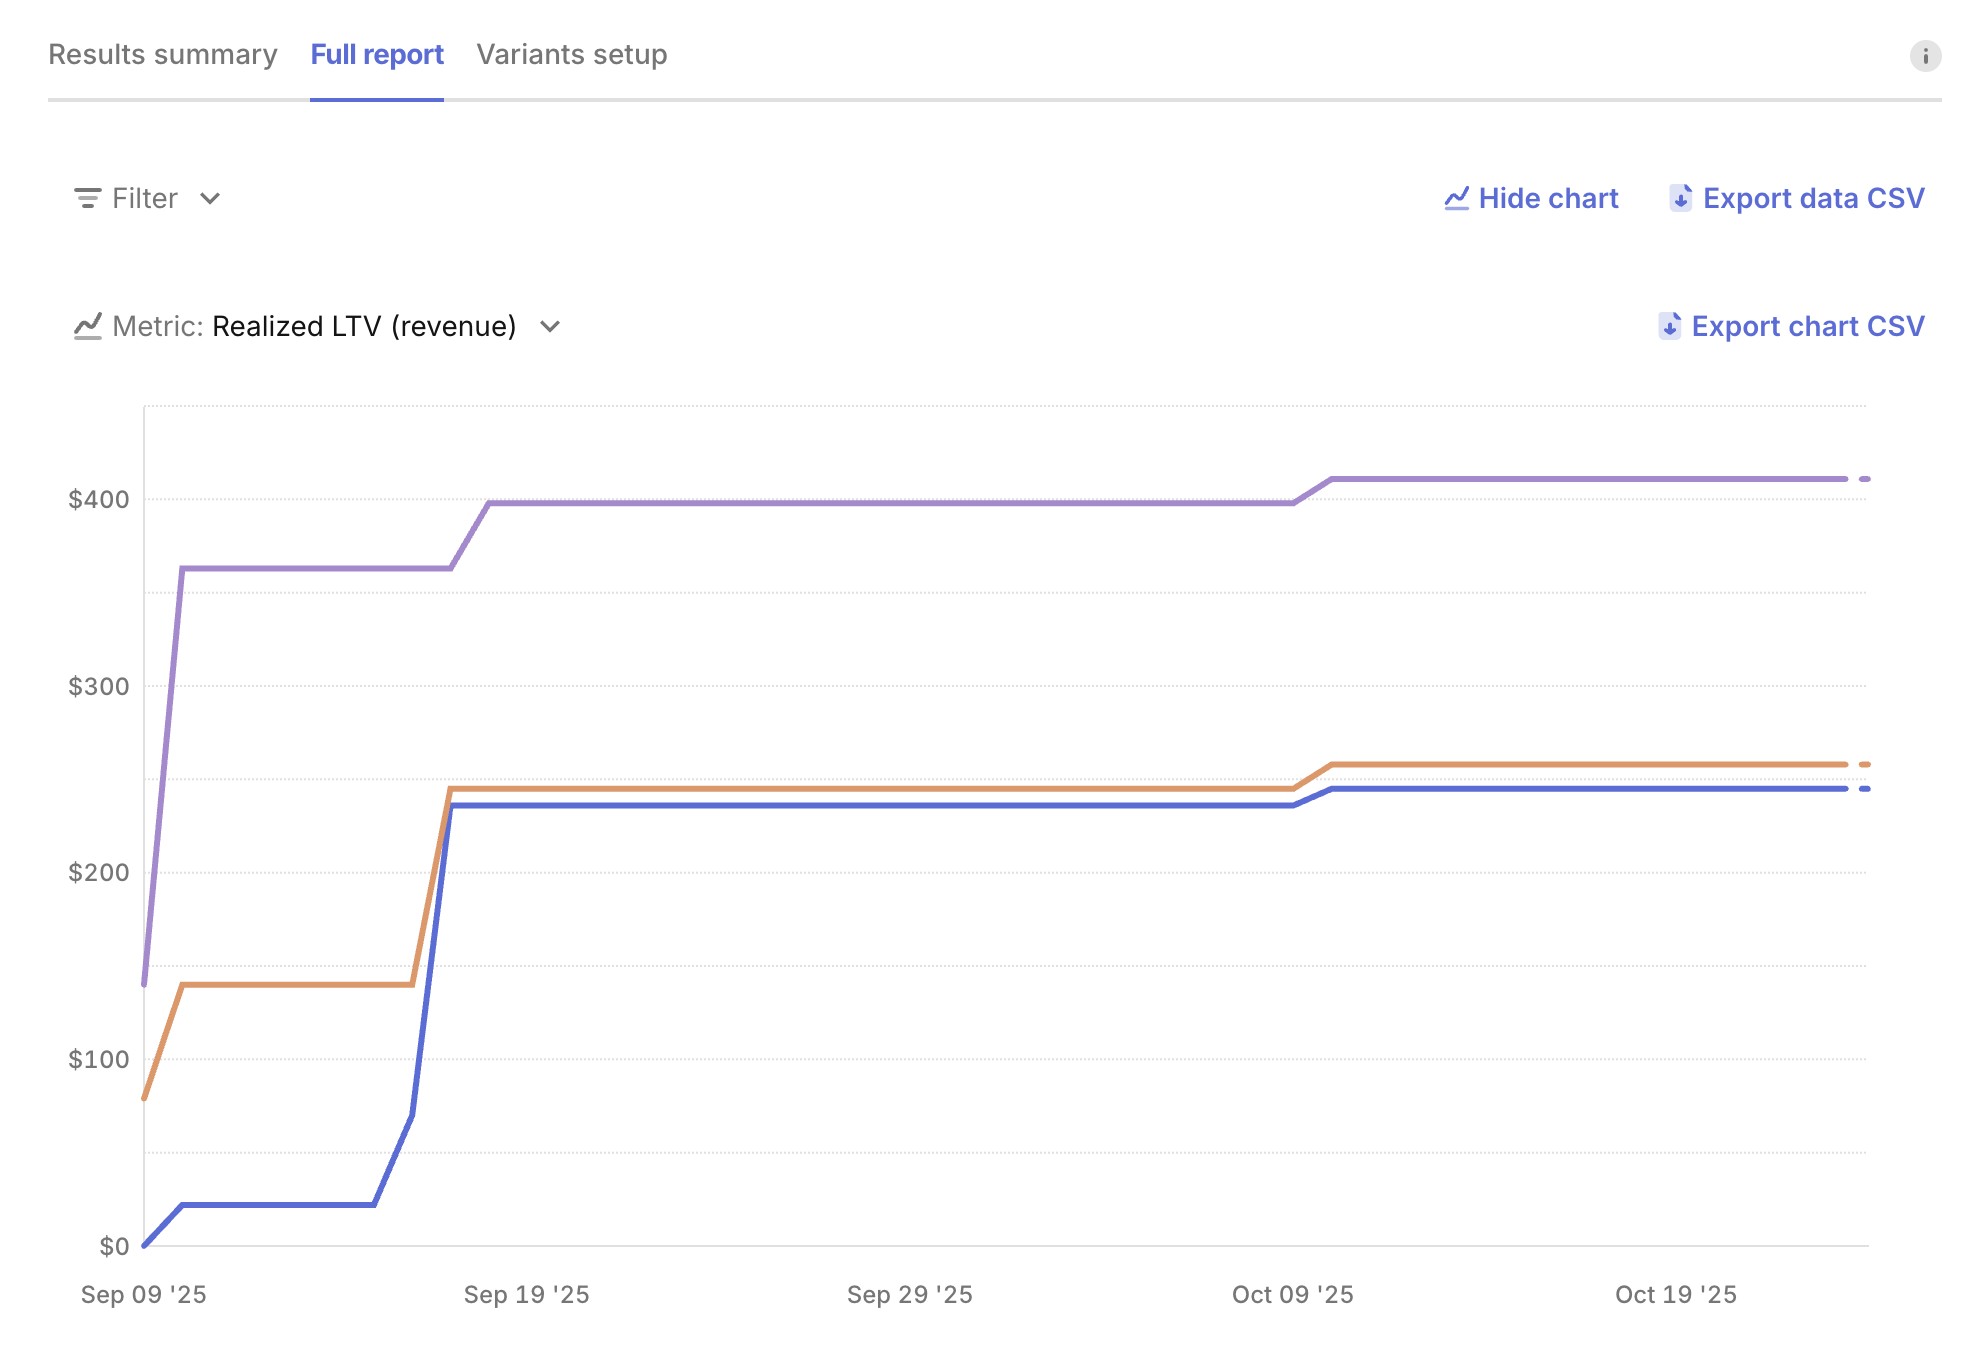
The results from your experiment can also be exported in this table format using the Export data CSV button. This will included aggregate results per variant, and per product results, for flexible analysis.
Variants setup
The Variants setup tab gives you an overview of the Offering linked to each variant. You can quickly access each Offering’s paywall, products, and metadata.
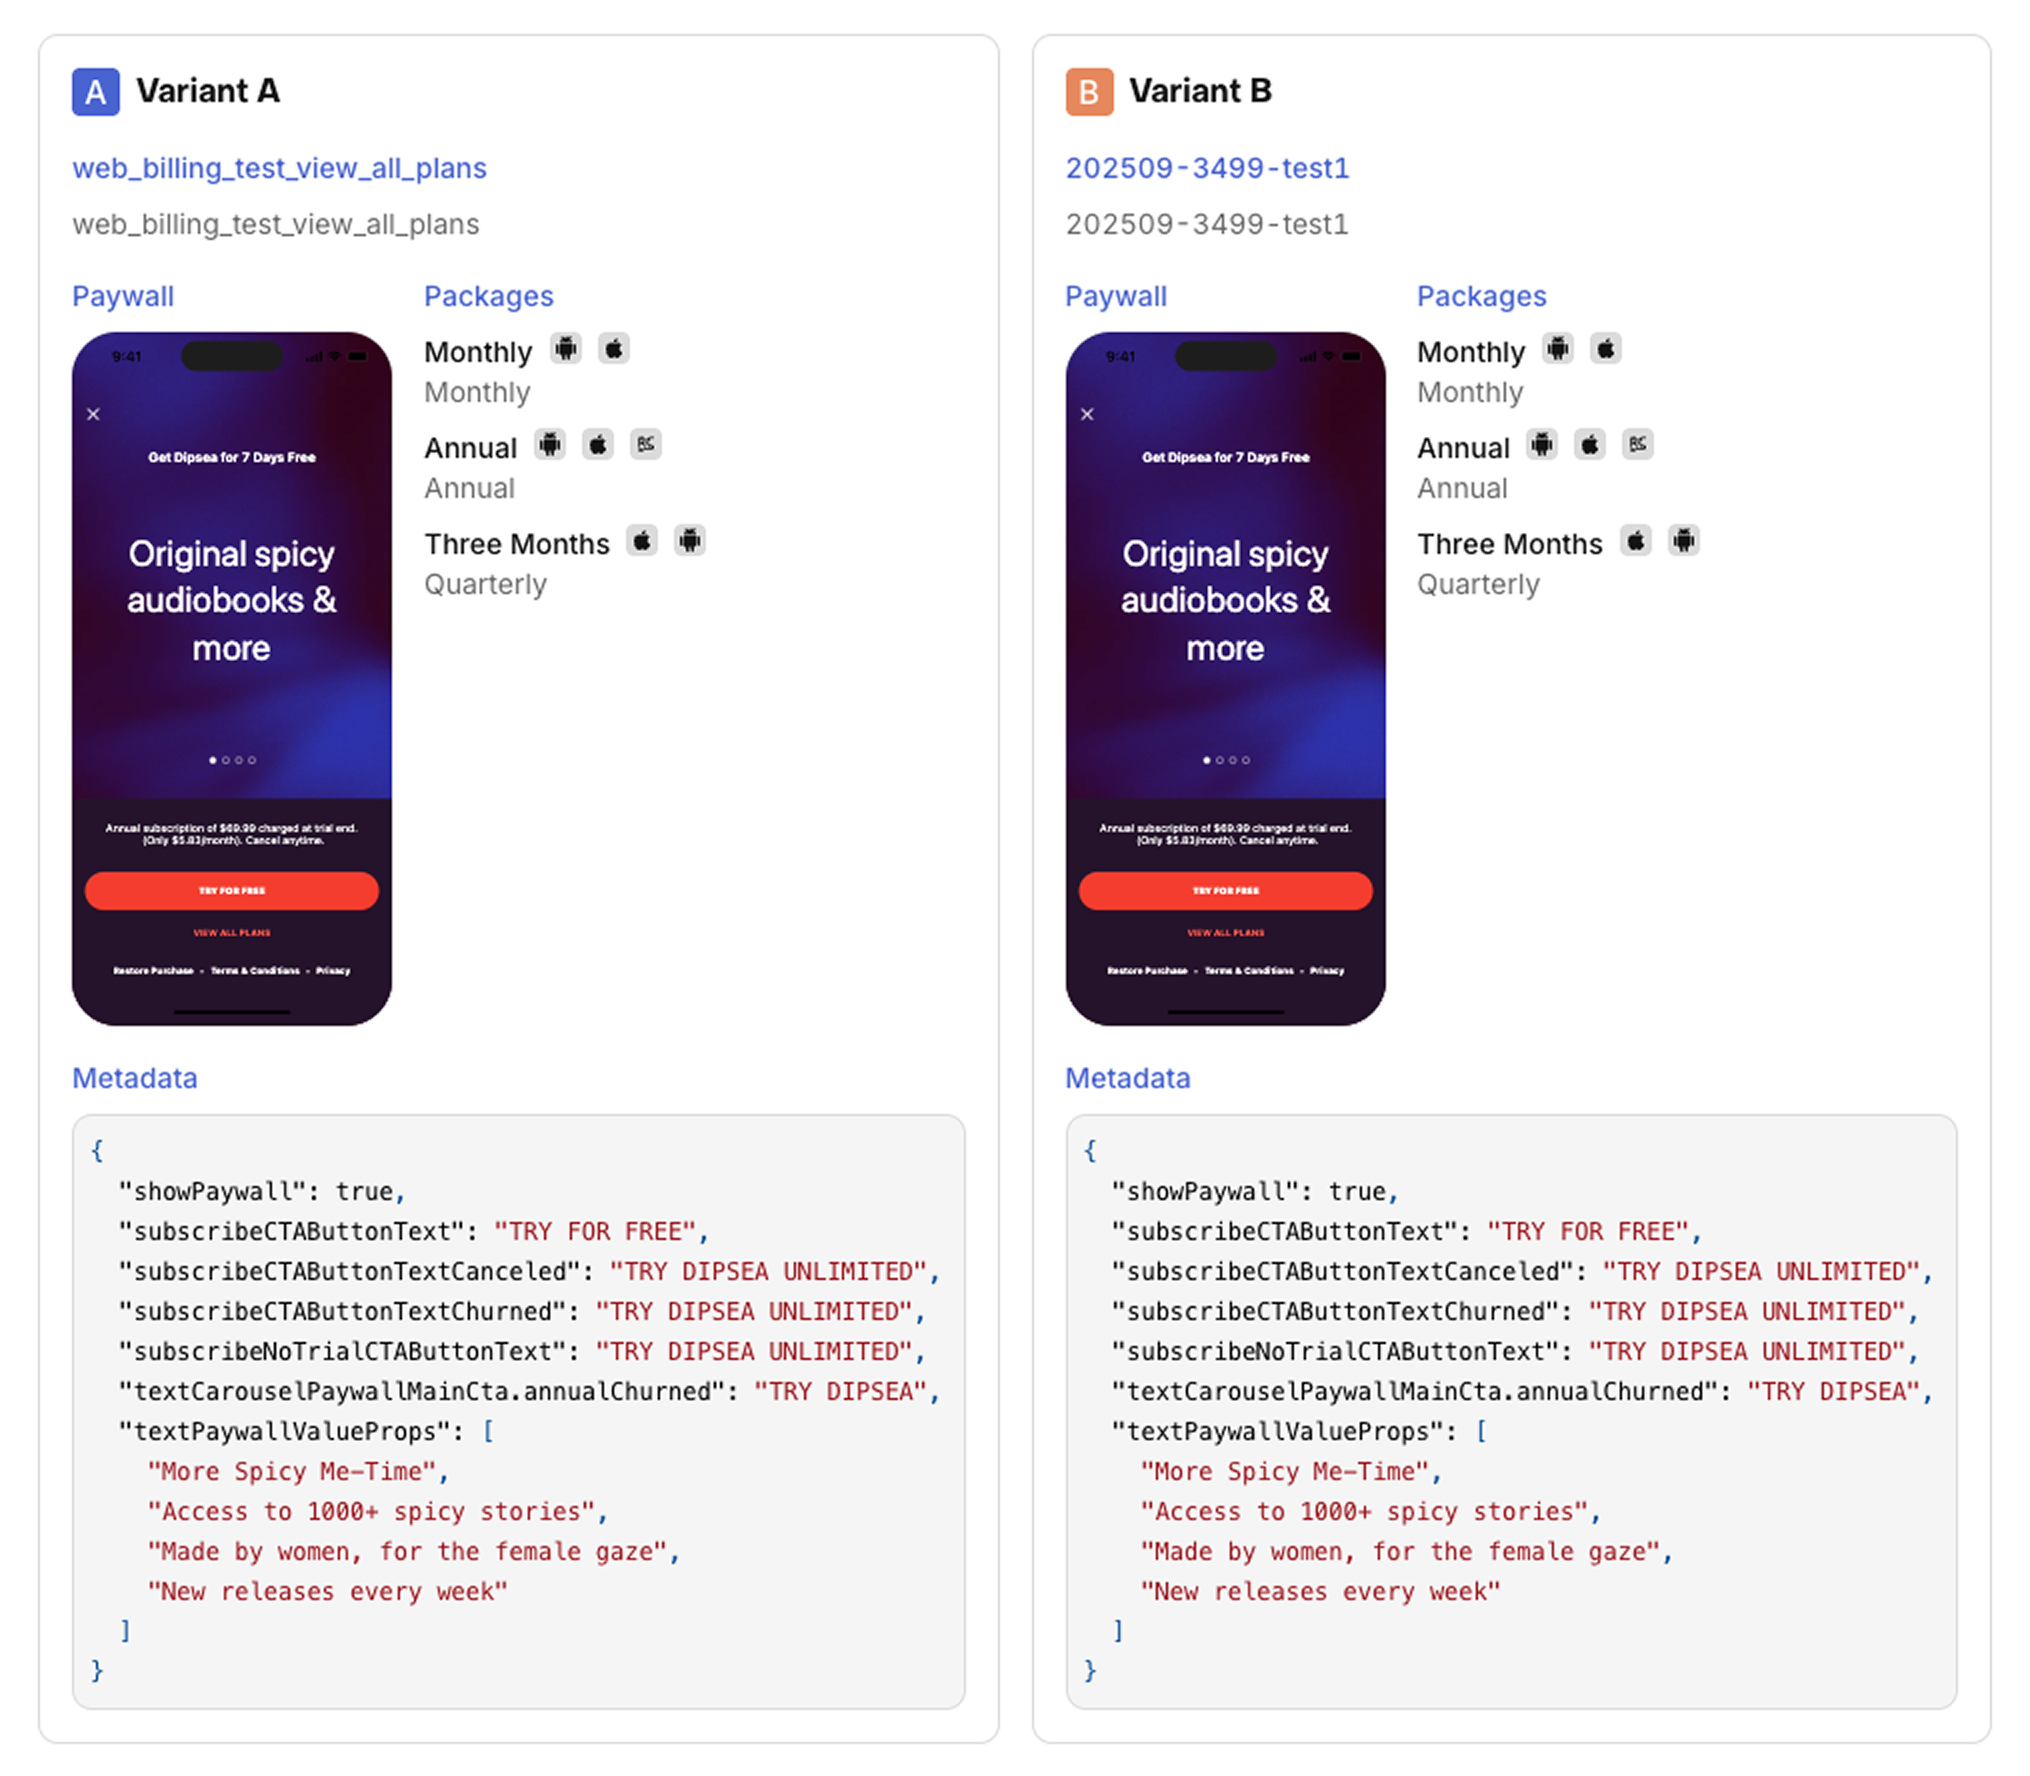
If your experiment uses placements, select the Offering name to view its full details.
Metric definitions
Initial conversion metric definitions
Sandbox and TestFlight installs are counted differently for enrollment, paywall views, and purchases. See Sandbox and TestFlight.
- Customers: All customers who've been included in each variant of the experiment, including customers enrolled from sandbox or TestFlight.
- Paywall viewers: The count of distinct customers who've reached a paywall in each variant in the experiment. Tracked automatically when you use RevenueCat Paywalls. For a custom paywall, your app has to report each view by calling
trackCustomPaywallImpression— see Tracking Custom Paywall Impressions. Views from the iOS Simulator, TestFlight, and other iOS sandbox installs aren't included. - Initial conversions: A purchase of any product offered to a customer in the experiment. This includes products with free trials and non-subscription products as well. Sandbox purchases aren't included.
- Initial conversion rate: The percent of customers who purchased any product.
- Trials started: The number of trials started.
- Trials completed: The number of trials completed. A trial may be completed due to its expiration or its conversion to paid.
- Trials converted: The number of trials that have converted to a paying subscription. Keep in mind that this metric will lag behind trials started due to the length of the trial offered. For example, if you're offering a 7-day trial, for the first 6 days of your experiment you will see trials started but none converted yet.
- Trial conversion rate: The percent of your completed trials that converted to paying subscriptions. (NOTE: A trial is considered complete on the day of its expiration, but it may not be until later that day that a trial conversion occurs and RevenueCat is informed of it by the store(s). This can cause your Trial conversion rate to appear lower than expected early in the day before all potential trial conversions have come through.)
Paid customers metric definitions
- Paid customers: The number of customers who made at least 1 payment. This includes payments for non-subscription products, but does NOT include free trials. Customers who later received a refund will be counted in this metric, but you can use "Refunded customers" to subtract them out.
- Conversion to paying: The percent of customers enrolled in the variant who made at least one payment on any product.
- Active subscribers: The number of customers with an active subscription as of the latest results update.
- Active subscribers (set to renew): The number of customers with an active subscription who are set to renew their subscription (e.g. they haven't cancelled) as of the latest results update. (NOTE: This measure is only available in the Customer Journey data table, not the Results chart.)
- Churned subscribers: The number of customers with a previously active subscription that has since churned as of the latest results update. A subscriber is considered churned once their subscription has expired (which may be at the end of their grace period if one was offered).
- Refunded customers: The number of customers who've received at least 1 refund.
Revenue metric definitions
-
Realized LTV (revenue): The total revenue that's been generated so far (realized) from each experiment variant.
-
Realized LTV per customer: The total revenue that's been generated so far (realized) from each experiment variant, divided by the number of customers in each variant. This should frequently be your primary success metric for determining which variant performed best.
-
Realized LTV per paying customer: The total revenue that's been generated so far (realized) from each experiment variant, divided by the number of paying customers in each variant. Compare this with "Conversion to paying" to understand if your differences in Realized LTV are coming the payment conversion funnel, or from the revenue generated from paying customers.
-
Total MRR: The total monthly recurring revenue your current active subscriptions in each variant would generate on a normalized monthly basis. Learn more about MRR here.
-
Total MRR (set to renew): The total monthly recurring revenue your current active subscriptions who are currently set to renew (e.g. they haven't cancelled) in each variant would generate on a normalized monthly basis. (NOTE: This measure is only available in the Customer Journey data table, not the Results chart.)
-
MRR per customer: The total monthly recurring revenue your current active subscriptions in each variant would generate on a normalized monthly basis, divided by the number of customers in each variant.
-
MRR per paying customer: The total monthly recurring revenue your current active subscriptions in each variant would generate on a normalized monthly basis, divided by the number of paying customers in each variant.
Experiments that enroll only new customers show all enrolled customers by default. Experiments that enroll new and existing customers show only the customers who viewed a paywall by default. The Paywall view filter controls this, and you can change or remove it at any time. When enrolling existing customers, keep in mind that their prior purchase history and experience with your app may influence their behavior differently than new customers.
Limitations and edge cases
These cases explain unexpected products, enrollment counts, paywall view counts, or attribution in experiment results. For setup constraints (what you can edit after an experiment starts), see Limitations and edge cases in Configuring Experiments.
Sandbox and TestFlight
Sandbox and TestFlight activity doesn't count the same way for every experiment metric. Experiment results have no sandbox toggle.
| Event | Included in experiment results? |
|---|---|
| Enrollment | Yes. Sandbox and TestFlight customers are assigned a variant and counted in Customers. |
| Paywall view | No, when the view was uploaded from an iOS sandbox environment. Paywall viewers and the Viewed filter count production views only. |
| Purchases, trials, and revenue | No. Sandbox purchases, including Test Store and platform sandboxes, are excluded from conversion, trial, and revenue metrics. |
On iOS, a paywall view is classified from the app that uploaded it, not from a purchase. This applies to RevenueCat Paywalls and to trackCustomPaywallImpression, including views recorded before anyone buys:
- The iOS Simulator is always sandbox.
- TestFlight is sandbox. A TestFlight install uses a sandbox receipt, so views from that install are sandbox even when the customer hasn't purchased.
- Any other install is sandbox when its app receipt is a sandbox receipt, such as a development build using a sandbox test account. A production App Store install isn't sandbox, and those views are included. A development build that doesn't yet have an app receipt isn't marked sandbox.
A successful impression upload doesn't mean the view will appear in results. A later production purchase doesn't reclassify an earlier sandbox view. A later view from a production install does count that customer as a paywall viewer.
This view classification is how the iOS SDK labels the upload. Sandbox purchases on any platform are still excluded from purchase and revenue metrics.
Products outside a variant's Offering
A variant's results can include purchases of products that aren't in that variant's Offering. Common causes:
- Your app serves products outside the Current Offering returned by RevenueCat for that customer. Confirm that every place you display products uses the Current Offering (or the Offering for the relevant placement) from RevenueCat.
- App Store subscription groups expose additional products outside that variant's Offering. Prefer a separate Subscription Group per Offering so customers who purchase from an experiment Offering only see that product set in iOS Subscription Settings.
- Aliasing or purchase transfers occurred between App User IDs. See Aliasing and transfers.
Aliasing and transfers
Experiment enrollment is per customer identity (App User ID). When the same store account or person is associated with more than one App User ID, results can look like a single journey was split across variants.
Alias (identity merge)
When two App User IDs are aliased, RevenueCat treats them as one customer. If both were enrolled in different variants of the same experiment, RevenueCat keeps the enrollment from the App User ID that was created first, regardless of which one enrolled first. Purchases that belonged to the newer identity can still appear under the older identity's variant, which can look like the wrong product for that Offering.
Transfer (purchases move, identities stay separate)
With Transfer to new App User ID (the default for most projects), a restore or purchase can move a subscription from one App User ID to another without merging those identities. Each App User ID can enroll independently, including into different variants of the same experiment. After a transfer, experiment results behave as follows:
- Both customers remain in enrollment counts for their respective variants. The original identity isn't removed from results when the subscription transfers.
- Purchase metrics are attributed to the customer who owns the subscription events after the transfer.
- Results aren't deduped by store account or
original_transaction_id.
That means one human or one Apple/Google subscription can contribute to both variants: for example a trial start under variant A on the first App User ID, then a paid conversion under variant B after a transfer. Product breakdowns can also show a product from variant A's Offering under variant B (or the reverse).
Purchase events are only attributed to a customer when they occurred at or after that customer's enrollment time. After a transfer, earlier events don't count toward the destination customer's metrics even when later renewals or conversions do. For example, a trial that started under the original App User ID isn't included in the destination's results if it started before the destination enrolled.
How to reduce this
- Prefer a stable custom App User ID and log in before purchase, instead of relying on anonymous IDs that can be recreated on reinstall or logout.
- Review your project's restore behavior so you understand when RevenueCat aliases vs transfers.
The "Other" product category
If enrolled customers purchase products that weren't in the Control or Treatment Offering, those purchases appear under Other in the product-level breakdown. That keeps total conversion and revenue impact visible even when revenue came from elsewhere in the app (for example a special offer that doesn't use the experiment Offering).
Enrollment counts vs other charts and analytics
Experiment enrollments vs the New Customers chart
Experiments count customers who enrolled and met the experiment's criteria while it was running. The New Customers chart cohorts by RevenueCat's best estimate of when someone was first new to the app. Store metadata can place a customer's first seen date earlier than when RevenueCat created them, so they can count toward experiment enrollment in the experiment window while the New Customers chart attributes them to an earlier date. This is more noticeable for apps that already had users before migrating to RevenueCat.
Enrollment lower than trials or paywall views in another tool
Experiments only enroll customers created from the SDK (or via GET /v1/subscribers/{app_user_id} with SDK metadata headers). Customers created with the Developer API aren't enrolled. See Customers created via the REST API.
FAQ
| Question | Answer |
|---|---|
| How can I review the individual customers who were enrolled in my experiment? | When using the Get or Create Subscriber endpoint you'll be able to see if an individual subscriber was enrolled in an experiment, and which variant they were assigned to, and can then pass that fact to other destinations like an analytics provider like Amplitude & Mixpanel, or your own internal database. |
| What filters are supported in experiments? | The Dashboard supports filtering experiment results by Platform, Country, and Paywall view (Viewed, Not viewed). This allows you to analyze results for a specific regional market or platform, or focus on the customers who saw a paywall. |
| How do I interpret results with 3 or 4 variants? | Each treatment variant (B, C, D) is compared independently against the control (Variant A). Look for the variant with the highest "Chance to win" and best performance on your primary metric. If multiple variants show promise, consider running a follow-up test between the top performers. |
| Can I export experiment results? | Yes, you can export results in CSV format from the Full report tab. Use "Export data CSV" for aggregate results per variant and product, or "Export chart CSV" for daily time-series data showing how metrics evolved throughout your experiment. |