

There’s a meeting I’ve sat in (some version of) too many times.
Paid acquisition says customer acquisition cost (CAC) is $42 when finance says it’s $67. Meta says one campaign is outperforming everything else, when the mobile measurement partner (MMP) is much less enthusiastic. Product is celebrating an 18% improvement in trial starts, but the revenue data suggests trial-to-paid is falling…
The meeting inevitably ends with someone opening a dashboard to clarify the numbers, only to find it sparks three new debates.
Everyone has data, and everyone can defend their number. Yet, no one can figure out what to do next. And this isn’t usually happening because a company has no data. It frequently happens when a company has lots of data, but no shared understanding of it.
This measurement dysfunction is one of the most underestimated barriers to app growth.
ATT broke the illusion of perfect attribution
If you were running mobile growth in 2021 and you’re still here, you’re already battle-tested. Apple’s App Tracking Transparency (ATT) framework became a reality with iOS 14.5 in April 2021, pushing the industry into a much more aggregated and privacy-preserving measurement world.
Lucas Moscon’s guide to SKAdNetwork (SKAN) describes the pre-ATT period as a time when user-level metrics made deterministic attribution much more accessible. Then came ATT, SKAN postbacks, conversion values, anonymity thresholds, shorter windows, and far less visibility at a user and creative level.
There was a fog around data: everyone was trying to work out what numbers they could still see (not many), what they could send back to the platforms (not much), and which parts of the old playbook still worked (again, not many).
But the industry adapted. We learned SKAN. We added more tracking. We got better at first-party data. Platforms built modeled attribution (hello, Meta’s Aggregated Event Measurement, or AEM). Teams got big into web funnels, incrementality tests, cohort analysis, marketing mix modeling (MMM) and more sophisticated internal business intelligence.
Five years later, the problem is almost the inverse of where we started: most subscription businesses now have more measurement than they did before ATT, but less alignment on what the numbers actually mean.
The numbers are going to disagree
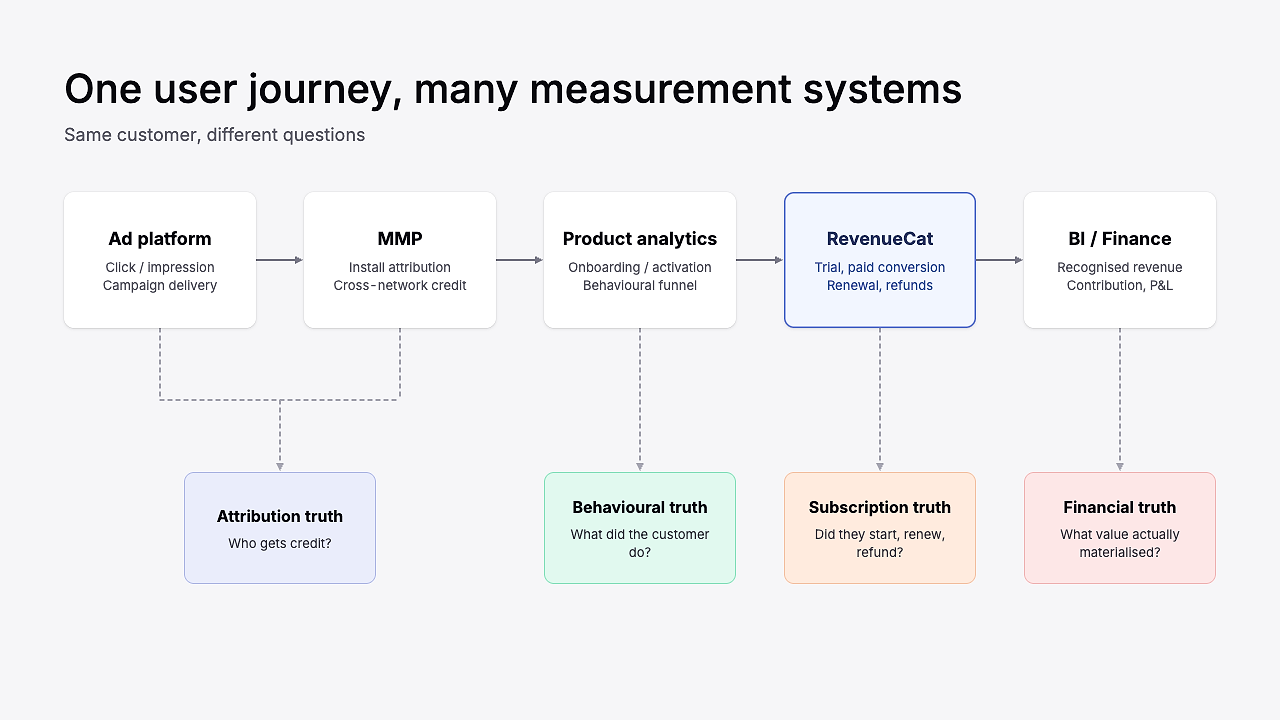
Today, each team working on a subscription app has gotten better at measuring their own part of the journey, but the connections between those views have definitely not improved at the same speed.
UA teams look at platform models and MMPs; product has richer behavioral analytics; finance keep their own revenue view; and subscription teams get better cohort and renewal data. But this segregated measurement is how you end up with five sophisticated systems and a basic argument about whether CAC is $42 or $67.
That does not mean the post-ATT measurement stack failed. It means we have to stop expecting each layer to produce the same answer.
One example is Meta: for one of our recent clients, Meta is reporting less than a third of the conversions we see in App Store Connect across the same period. That’s a huge gap if you look at the two numbers and assume they are supposed to match.
We don’t panic about it. We don’t believe the campaigns suddenly became 3.5x worse. Most importantly, we don’t spend the week trying to make Meta and App Store Connect display the same conversion total. What we do do is understand the gap:
- Is it broadly stable?
- Does it widen or narrow when we change how spend is deployed?
- Does Meta still correctly identify the campaigns and creatives that are relatively stronger or weaker?
- What happens to the business-level numbers when we scale?
Once you know those answers, an under-reporting platform can still be very useful. It just cannot be treated as a complete representation of reality.
This is something David Vargas has talked about - his LinkedIn is basically a running catalog of what iOS measurement looks like in the real world. In one example, RevenueCat showed 90 free trials while Meta AEM reported 33. In another, the App Store produced a materially lower cost per trial than AEM.
The point is not that Meta is uniquely bad. It’s that discrepancy in your data is normal.
Identify your normal disagreement
The way we solve this at Aperture is by defining what ‘normal disagreement’ looks like. E.g. if Meta usually reports 35% fewer trials than your baseline, that’s your normal disagreement. Seeing 100 trials on your baseline tool and 65 on Meta isn’t concerning. But if that gap suddenly becomes 70% disagreement, then that is worth investigating. A stable mismatch is very different from a new mismatch.
This is the part a lot of measurement frameworks miss. Reliable data doesn’t mean identical numbers. It requires the team to understand why the numbers differ, roughly by how much, and what would count as an anomaly.
In short, the useful question is not “which dashboard is right?” It is: what decision am I trying to make with this number?
Build the measurement system around decisions
A lot of companies experiencing this kind of measurement pain respond by building another dashboard to bring all the numbers into one place. And sometimes — on rare occasions — that is useful.
But if the numbers are already inconsistent, then a new dashboard is only a means to display those inconsistent numbers together.
I would start somewhere less exciting: write down the decisions your team repeatedly needs to make, like:
- Should we increase channel spend next week?
- Which ad set gets the next $1,000?
- Did the paywall test improve the business?
- Is the US cohort genuinely better than the UK cohort?
- Can we afford to acquire a customer at $60?
- Is this channel adding customers or mostly taking credit for demand we already had?
Then, for each decision, decide four things:
- The fastest useful signal: what can move quickly enough to help you act?
- The downstream guardrail: what stops you from declaring a false win?
- The business anchor: what blended outcome should ultimately move if the strategy is working?
- The evidence threshold: how certain do you need to be given the size and reversibility of the decision?
Here’s what that looks like for four common decisions:
The same measurement stack should use different signals for different kinds of decisions. Only after sorting that would I worry about whether the company needs another reporting tool.
Match the evidence to the decision
Once you accept that no single metric can do every job, the next question becomes much easier: how much evidence does this decision actually require?
I’ve had versions of this debate for years. In a Singular Growth Masterminds conversation, John Koetsier and I talked about teams wanting to judge every product experiment on lifetime value. The intention is good, and LTV is important, but you cannot necessarily use lifetime value to judge a week-long experiment. You would never learn anything quickly enough.
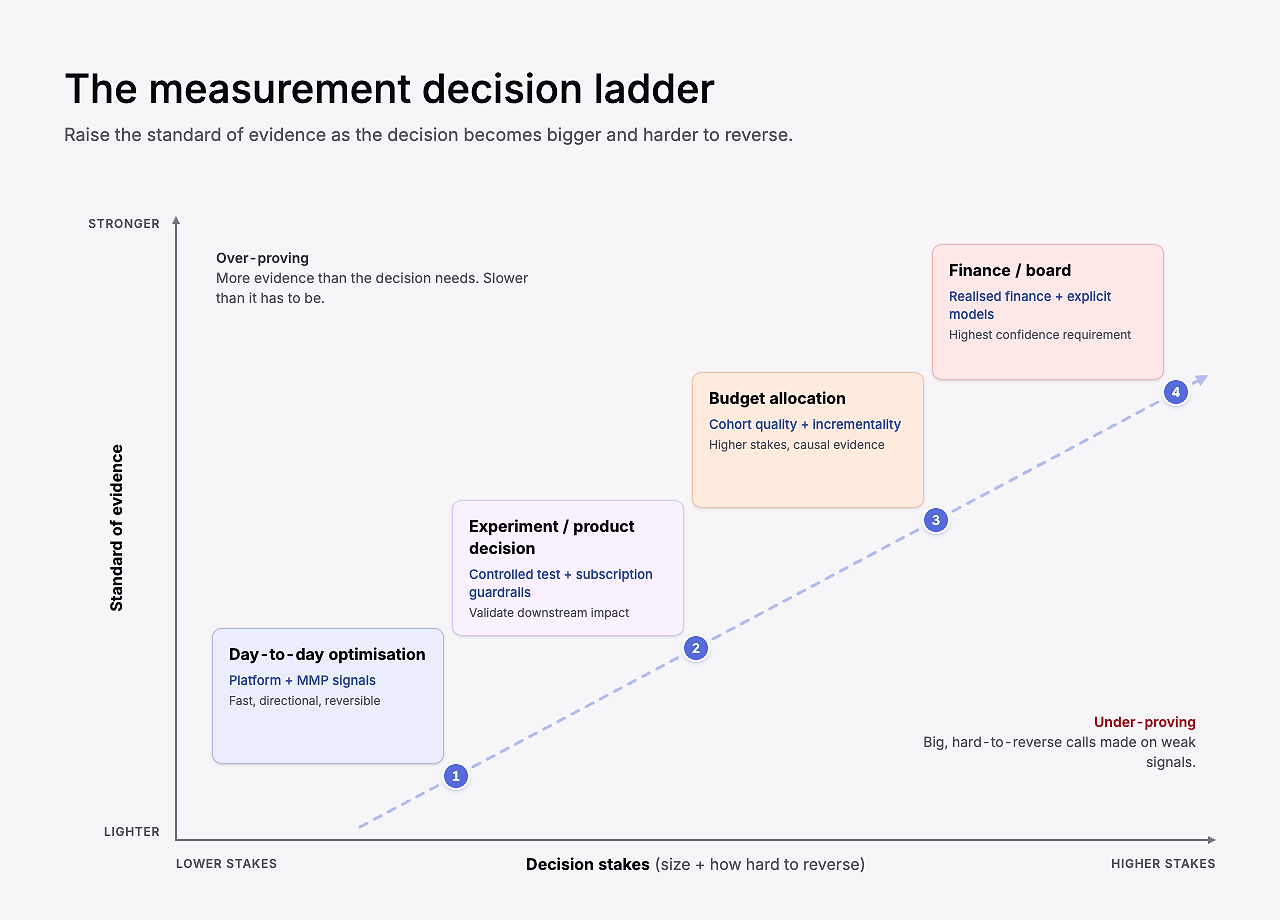
We must also consider the stakes of each decision. Looking at our four common decisions above — each differs drastically. A $500 creative-allocation decision tomorrow does not require the same evidence as moving $3 million of annual spend between channels next week. For the first decision, platform data can be perfectly adequate, if you understand the usual reporting gap and you are watching the blended business outcome.
For a paywall or pricing change, I want a controlled experiment and downstream subscription guardrails. For a large channel reallocation, I want cohort quality, blended performance and, where possible, incrementality evidence. For financial planning, I care far more about realized financial data and explicit assumptions.
This is also why directional data is not dirty data. The obsession with perfect measurement can become another form of paralysis.
If Meta consistently finds one creative at half the reported cost per trial of everything else, I do not need to wait a year to put more budget behind it. But I do want to know whether the creative is bringing in a cohort that converts and retains sensibly, and whether blended economics remain healthy as spend increases.
The standard of evidence rises with the cost of being wrong.
How Opal kept it simple
A good example is Opal. On Sub Club, Opal’s CEO, Kenneth Schlenker, shared that the seven-person team had reached $5 million annual recurring revenue (ARR) (and they’ve since doubled that).
Opal invested in paid acquisition early, but rather than trying to build an enormous measurement framework, they focused on Day 8 return on ad spend (ROAS) as a practical growth signal. Kenneth described the approach as “just focusing on this one metric: Day 8 return on ad spend.”
That number wasn’t the final answer to every question about the business. But it was useful because it was available quickly enough to make decisions, and close enough to the economics they cared about.
The lesson
There’s an important difference between an imperfect metric and a useless metric. Growth teams get into trouble when they forget that.
Use blended metrics as your business reality
When the attribution gets noisy, I like to retrace my steps back to the boring numbers.
How much did you spend? How many customers did you acquire? How much revenue did those customers generate?
That blended view is your anchor.
If the business spent $200,000 during a period, and acquired 4,000 new paying customers, the blended acquisition cost is $50. There will still undoubtedly be debate about which channels caused those customers, which captured demand, or how organic growth contributed. But before you have that debate, you at least know the economic boundary the models have to fit inside.
- Platform data helps us make decisions inside the platform
- Attribution helps us understand where growth appears to be coming from
- Blended performance tells us whether the business as a whole is actually becoming more efficient
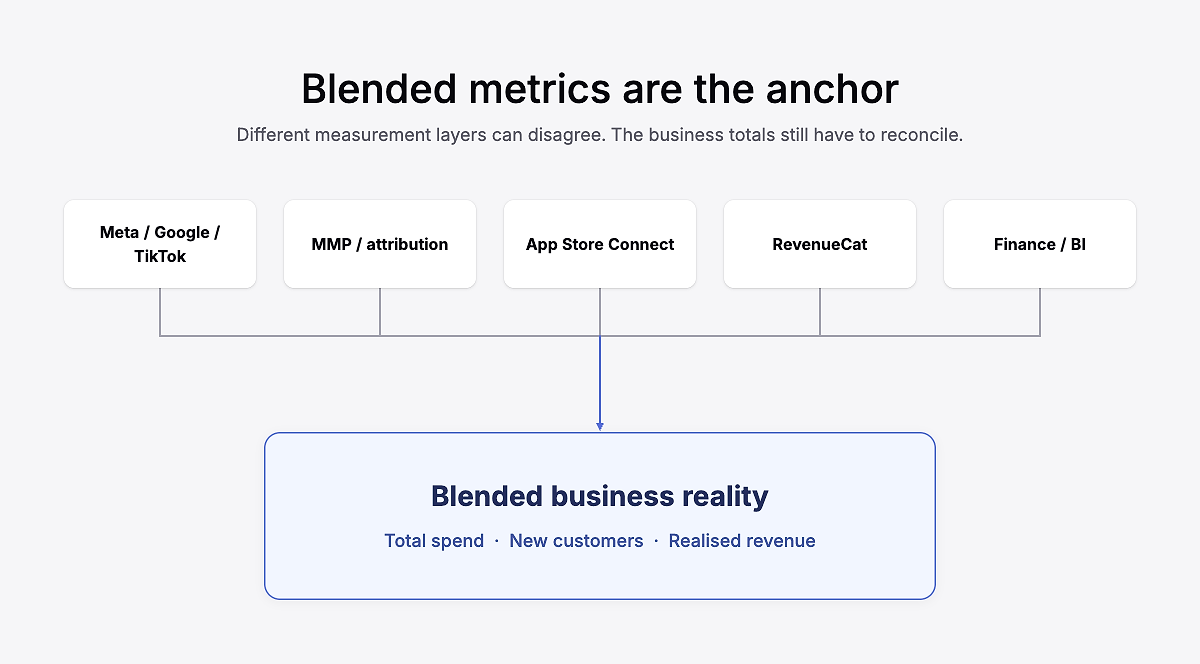
Blended reporting does not solve attribution. It doesn’t tell you whether Meta caused customer #4,382 to subscribe, but it does tell you what you put into the machine and what came out.
Perhaps even more importantly, it also gives you somewhere to sanity-check the stories your channels are telling you. E.g. if every ad platform claims more conversions than the business acquired in total, you know the channel reports cannot all be interpreted literally.
I often think of this as working from the outside in. Start with the size and economics of the whole pie, then use attribution and segmentation to work out how it’s being divided. If you start with the individual slices, you risk scaling a channel that looks brilliant in isolation, while the overall business barely moves.
Beware: blended truth still hides averages
There is a catch to everything I have just said about blended metrics: averages can hide important differences too.
Blended CAC is a fantastic anchor. But it is not a segmentation strategy.
Eric Crowley made this point years ago when discussing LTV: “The problem with this metric, and lots of other metrics, is that they are derived from an average.”
You’ve probably heard about ‘tourists’ and ‘locals’ — tourists may subscribe quickly, but also churn quickly. On the other hand, locals can become deeply engaged, long-lived customers. Put both groups into one average and you can end up with a number that represents neither.
The same problem appears everywhere in subscription growth. A blended trial-to-paid rate can hide one country converting brilliantly and another badly; overall LTV can hide radically different monthly and annual subscribers; and average CAC can hide an audience that is cheap to trial but expensive to pay.
Time creates another complication. RevenueCat Charts distinguishes realized LTV from predicted LTV: one reflects value already generated; the other estimates future value. A Day 30 realized cohort is observed but immature. A 12-month predicted LTV is more complete, but it’s an estimate rather than observed data. Both are useful: finance may care about contribution after fees and refunds, while growth may need an earlier gross-revenue signal to decide whether to scale tomorrow.
Across all metrics, it’s never as simple as “this is always the best one to use”. The hierarchy is not ‘blended good, segmented bad’. It’s more:
Use blended metrics to understand whether the business economics work. Then segment to understand why they work, where they are breaking, and which levers you should pull next.
What good measurement actually looks like
After all of this, you can see that good measurement is actually pretty unglamorous. And it’s never as clear as it seems.
A trial-conversion lift can look great until those users cancel more often. A channel can look efficient until you zoom out and realize the blended economics are moving in the wrong direction. None of that makes the original number useless. It just means no single metric gets to answer every question.
The goal is not to make every system agree. The goal is to know:
- What each number is useful for
- When to sense-check the number against the blended picture
- Which numbers help you operate day to day
- Which ones tell you whether the business is healthy
- Which decisions are important enough to require extra evidence
The measurement stack will keep changing. We made it through ATT, SKAN, disappearing user-level signals, and several years of being told attribution was dead. There will be another version of this problem.
But if everyone can look at the data and know what to do next, the measurement is doing its job.