
If you start researching activation metrics, you’ll find no shortage of suggestions:
- Signups
- Trials completed
- Session length
- Onboarding completion
On the surface, these all sound like reasonable things you should probably keep an eye on.
The problem? Most of these metrics focus on volume, not quality. They tell you how many people moved through a step, not whether those people became meaningful users, paying users, or users who actually stuck around.
In short, they don’t show whether someone truly activated in a way that drives retention or monetization.
Activation isn’t the same as signing up, and it’s not the same as completing onboarding — which means many ‘activation metrics’ will lead you astray.
What happens when you focus on the wrong metrics
Case 1: onboarding is performing, but activation isn’t happening
I see this all the time in growth audits and client work. In one example, onboarding completion rates were stellar — over 90% on both iOS and Android. The team felt confident that activation was in a good place.
But when we dug deeper, most of those users were gone by day two.
The onboarding flow was easy, short, and clear, but users weren’t engaging with the parts of the product that actually mattered or experiencing real value. Onboarding completion looked good, but the activation issue persisted.
Case 2: feature usage looks good, but only for a segment
In another example, activation metrics looked strong at first glance:
- Good engagement
- Healthy feature usage
But once we segmented free versus paid users, the picture changed entirely. Free users were inflating almost every metric; they were active, engaged, and numerous, but weren’t converting, renewing, or contributing to revenue.
After we isolated paid cohorts, it became clear that activation quality for the users who actually mattered was much poorer than topline numbers suggested.
These two cases highlight the risks of misinterpreting activation metrics, either by focusing on the wrong metric or by failing to segment your data meaningfully.
How to get to the right metrics
We’re going to look at:
- Which activation metrics actually matter for subscription apps
- How to avoid metrics that sound useful but don’t predict retention or revenue
- How to define your own activation metric instead of copying someone else’s
- How to test whether your chosen metric is real or just a vanity signal
I wish I could give you a magical activation metric and call it a day, but every app and use case requires a slightly different approach. The best I can offer is a framework to distinguish metrics that truly matter from those that merely look good.
Because here’s the truth: retention doesn’t happen without activation.
Many apps think they have a retention or monetization problem, but zooming out often reveals that users drop off before they experience meaningful value or form a habit.
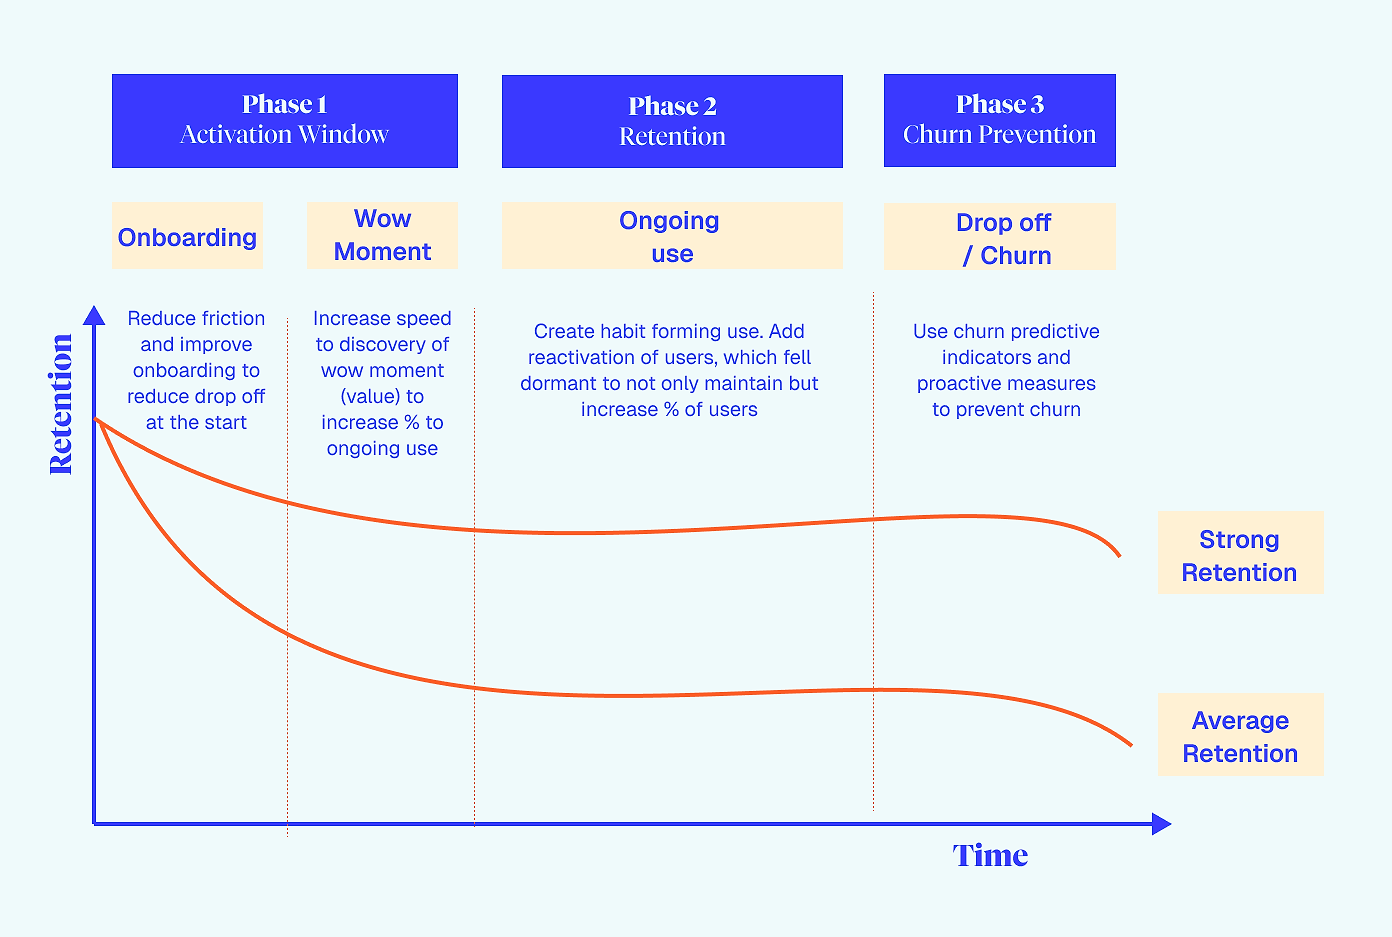
Credit: Diagram created together with Thorsten Strauss, Hello Growth
The metrics you need to focus on depend on whether the problem is activation or retention.
The real question is: are people not sticking around because your product isn’t useful, or because they never truly activated in the first place?
That’s exactly what the right activation metrics help you figure out.
What activation really means for a subscription app
Before defining the right activation metric, we need to be clear on what activation actually is, because this is where things often get muddled.
I frequently see teams conflate activation with acquisition, label generic engagement metrics as activation, or treat it as simply ‘the steps a user completes’ rather than whether those steps actually move them toward becoming a long-term subscriber.
But we’re not here to get lost in terminology debates. Let’s keep it simple.
Activation happens when a user reaches meaningful value early enough in their journey that it becomes likely they will:
- Convert (if they’re on a trial or freemium path)
- Stay through their first renewal
- Retain beyond that initial period
It’s not about completing an onboarding flow or ticking off a checklist. It’s about whether early behavior predicts survival and long-term value.
Or put another way:
- Activation isn’t “Did they do the steps?”
- Activation is “Did the steps they took meaningfully increase their odds of getting value and, as a result, staying and paying?”
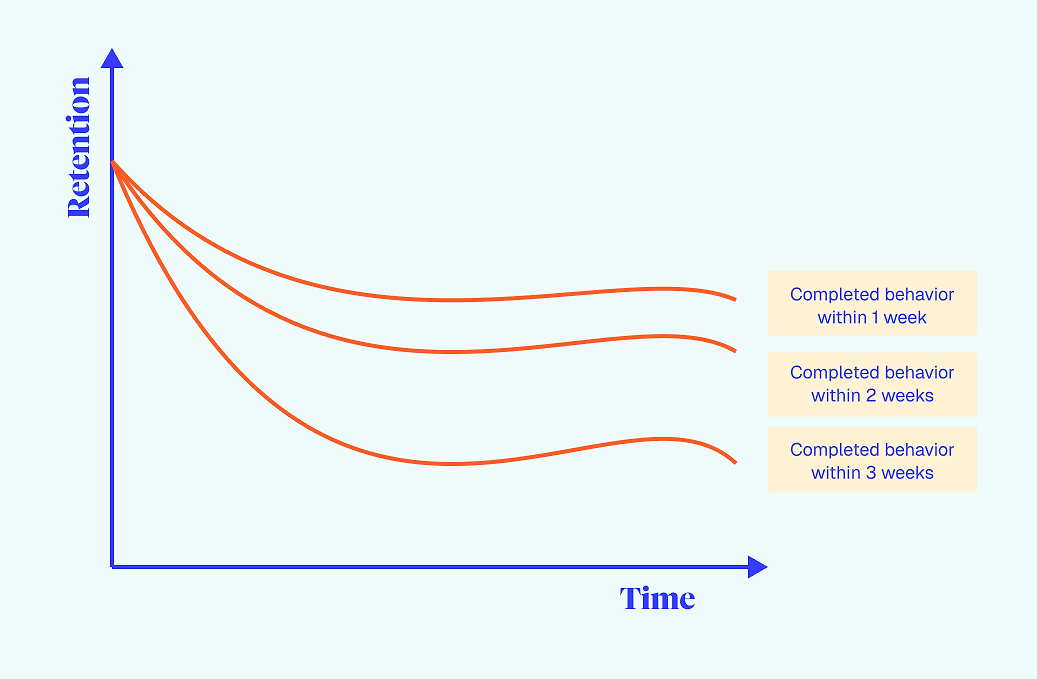
You can test this by comparing retention curves for users who performed a particular action versus those who didn’t.
But here’s the catch: almost any action will look better than doing nothing, so you need to focus on actions that truly predict long-term retention and monetization.
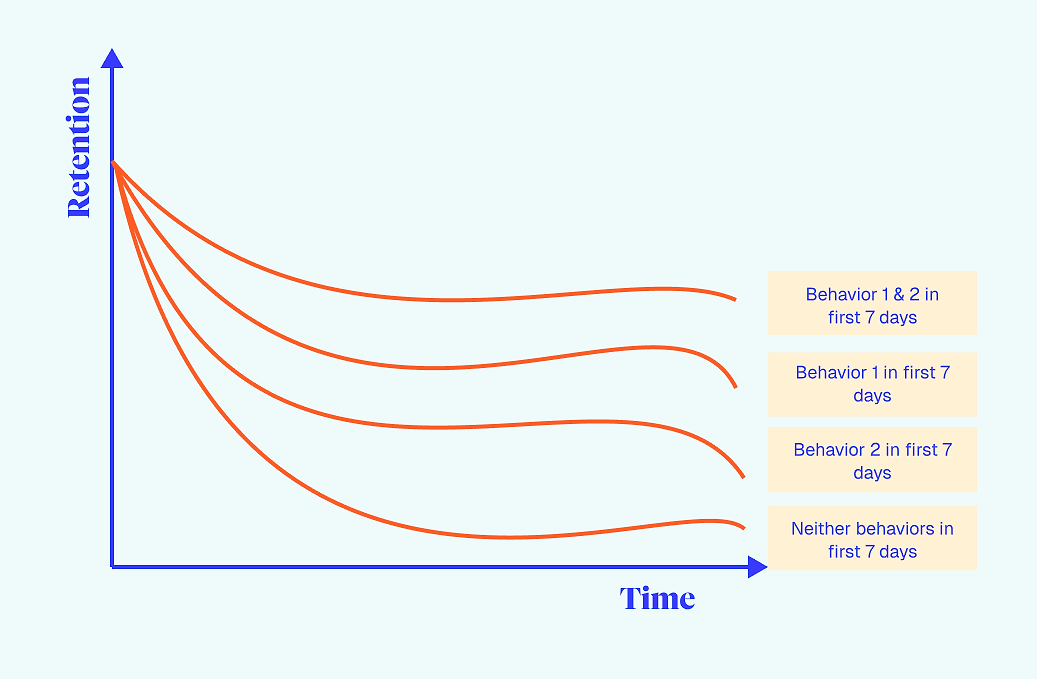
Hypothetical retention curves for two different in-app behaviors
The real question is whether that specific action is truly predictive of retention and high-value users. The goal isn’t just to track activity; it’s to identify behaviors that correlate with long-term subscribers, versus actions (or inaction) that signal faster churn or low-value usage.
Two layers of activation: first value and core value
When thinking about activation in subscription apps, it helps not to treat it as a single moment. Your first session matters of course, but according to the State of Subscription App Report 2025, the largest share of trials occurs on Day 0 across both freemium and hard-paywall apps.
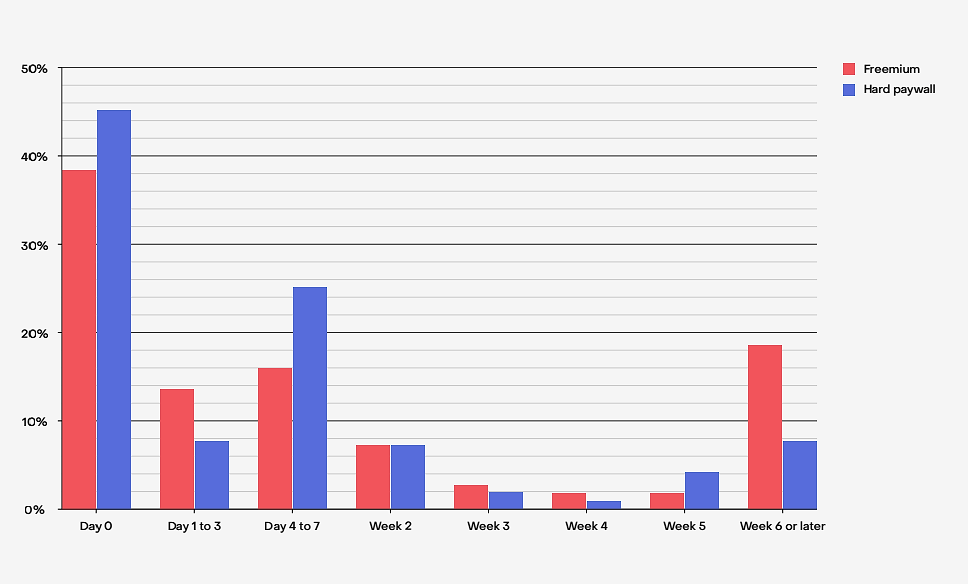
SOSA 2025: Day at which trials are started for freemium vs. hard paywall apps
That said, activation is just one moment in building a habit. In subscription apps, it’s rarely a single step.
I like how Product-Led Growth by Wes Bush breaks it up into three moments:
- Moment of value perception: users understand the value, e.g. by seeing an example or visual
- Moment of value experience: users experience the value themselves, e.g. using the app’s main feature for the first time
- Moment of value adoption: users begin using the app in a meaningful way, e.g. building a habit
What we often talk about for apps is this idea of ‘Time to First Value’ and that usually covers the first two moments. The core value only emerges once behavior starts to repeat.
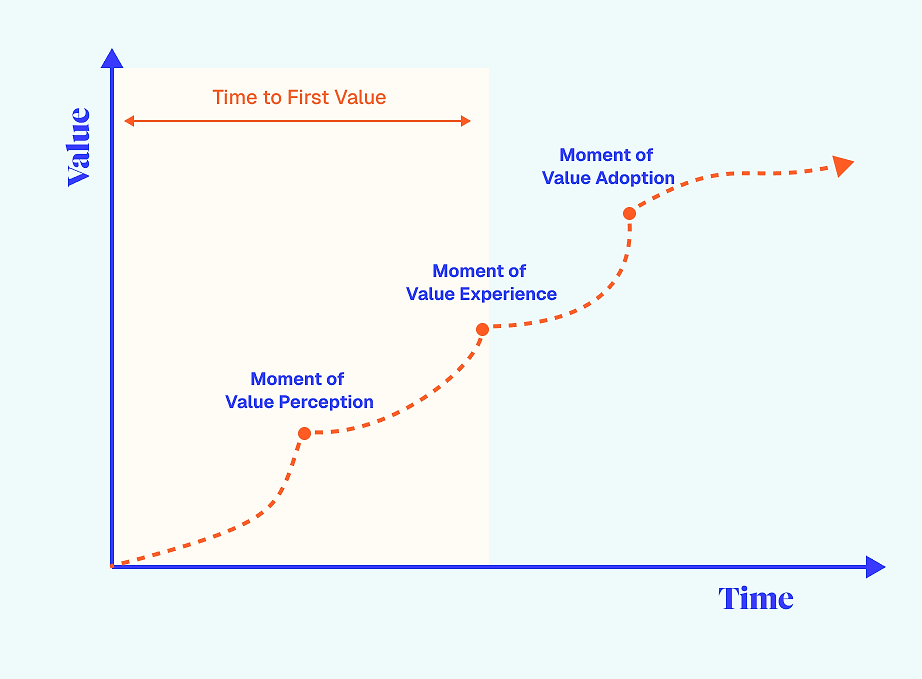
Credit: Slightly adjusted diagram based on original diagram from Product-Led Growth by Wes Bush
Let’s dive deeper into those two parts.
1. Time to first value (TTFV): moment of value perception and experience
TTFV is the user’s perceived and experienced value. It’s often small, but it matters because:
- The steepest drop-off happens right at the beginning
- Many users decide whether to continue or disengage very early
If users don’t see value early, they may never reach meaningful activation, no matter how strong the product becomes later.
This first-value moment should feel like progress, not just effort or friction for its own sake. Long onboarding flows might be trendy, but don’t use them just to fill time; they rarely help activation.
2. Time to core value (habit or sustained usage): moment of value adoption
Core value usually takes longer to reach. This is where users move from trying the product to using it in ways that predict retention.
It’s especially important for:
- Habit-forming products
- Wellness or tracking apps
- Financial or budgeting tools
- Apps with more complex workflows (e.g. B2B apps)
For example, for a language-learning app, completing a single lesson might signal the first value. But core value emerges once someone completes several lessons over multiple days and starts to build a routine. It may be measured by the moment they know 30 words in the new language or can form five complete sentences.
Many teams get stuck optimising only for the first session, without checking whether users reach the behaviors that matter later. For one app I worked on, we used day-7 retention as a success metric by ensuring experiments extended beyond session one, including push notifications and sessions two and three, to identify what would get users back enough in the first week to stick around.
When defining activation, don’t just ask: “What happens on day one?”
Also ask: “What must occur before a user behaves like a retained user?”
The key is that both layers matter, but in different ways.
- First value helps prevent early drop-off
- Core value predicts whether users will sustain and ultimately retain
Metrics that actually matter for activation
Now we’ve defined activation, the next question is: which metrics really matter?
It depends on your app (I know, such an annoying answer!), but if you’ve done the thinking above and run the numbers, you should already have a sense of:
- Which behaviors predict retention
- Which features deliver meaningful value
- What your first value and core value moments look like
From there, the most important metrics are the ones that show whether users are reaching those value moments in ways that drive retention and conversion, not just ticking off steps or generating volume.
To help you better distinguish between noise and signal for your subscription app, here are examples of metrics that matter, metrics that inform, and ones that just distract.
Metrics that matter
These metrics are most likely to reflect real activation quality.
1. Percentage of users reaching the first value
This metric shows how many users reach the initial mini aha! moment, aka the first value.
Measuring this early step (perceived value) can be tricky in apps, but you can get a good sense by tracking whether users:
- Complete a meaningful setup step
- View a personalized insight
- Return within 24 hours after their first session
Why it matters: It shows whether drop-offs are happening before users ever reach the value.
You’re not trying to force everyone to reach it instantly. The goal is to ensure enough users experience value early enough to avoid churning before activation.
If not enough of your users are reaching the first value moment, you have an activation problem, not a retention problem.
2. Percentage of users reaching the core value
This is the deeper signal, the next step in the journey. It shows whether users are forming patterns or habits that support retention.
This metric is often far more predictive of long-term success than anything that happens in the first session. The core value usually doesn’t happen immediately; it often emerges later, once users engage repeatedly with the product.
3. Time to first value (used thoughtfully)
Time to first value can be useful, but only as a diagnostic metric, not a goal in itself.
For first value, faster is generally better, but only if the experience still delivers genuine value. It’s better to provide meaningful value slightly slower than superficial value quickly.
For core value, timing matters relative to behavior. If reaching core value in week one versus week two predicts very different retention outcomes, then timing becomes a meaningful signal.
How timing of behavior can impact activation and in turn retention
The insight here isn’t ‘shorter is always better’. It’s that timing tells you something about activation quality.
4. How activation shows up in your funnel
Once you know how many users reach first and core value, these standard subscription metrics tell you whether that activation is turning into revenue:
- Trial start rate (if you offer a trial)
- Trial-to-paid conversion rate (if you offer a trial)
- Download-to-paid conversion rate
The key: never look at these metrics in isolation.
For example, you might see a high trial start rate but a low trial-to-paid conversion rate. That doesn’t necessarily mean the trial itself is the problem. Often, users are starting a trial before they’ve actually experienced value, then canceling quickly ‘just in case’.
The right move might be to:
- Slow down the path to trial
- Improve value delivery first
- Accept lower trial volume in exchange for higher-quality users
Again, when it comes to activation metrics, quality over volume is what drives retention.
Metrics that inform (but shouldn’t be success KPIs)
Some metrics are useful for understanding activation, but they shouldn’t be treated as proof of success.
1. Onboarding completion rate
Onboarding completion is one of the most overused activation metrics. A high completion rate does not guarantee activation is working.
In some cases, adding positive friction actually improves activation quality by helping you understand users, tailor experiences, and build trust before asking for commitment.
Instead of asking “How do we increase onboarding completion?”, ask:
- Do users who complete onboarding retain better?
- Are we helping the right users progress?
- Are we losing good users too early, or filtering out low-intent users later than we should?
Completion is a signal, not a goal.
2. Feature adoption (with the right segmentation)
Feature adoption can be insightful, but only if you look at it through the right lens.
Average adoption rates often hide the story. A feature may appear lightly used overall, but be heavily used by high-LTV or paying users. Meanwhile, some features add complexity without contributing to retention.
Feature adoption is most useful for understanding:
- Which features support retention
- Whether free users understand the value of premium features
- Which features are adding noise rather than helping users activate
I had an app where very few free users tried the main premium feature (it was available with limited usage to free users). As a result, they weren’t activating properly and were unlikely to pay — they didn’t see the value.
Feature adoption is also useful for spotting noise. If only 2% of users use a feature, and they aren’t your most valuable users, so ask whether it’s adding complexity rather than contributing to activation.
On that note, check out this great podcast on the adoption thresholds used at Netflix.
Metrics that distract
These metrics are easy to over-optimize and often pull growth teams in the wrong direction.
1. Total signups
More signups don’t automatically mean better growth. While signups are necessary to feed volume into the funnel, optimizing for quantity alone can:
- Attract lower-quality users
- Mask activation problems
- Give acquisition teams the wrong incentives
Sometimes the right move is fewer signups, but higher-quality traffic that is more likely to activate and retain.
2. Trials started
A high trial start rate doesn’t automatically create more paying customers. In some cases, users start a trial before truly experiencing value, which can lead to:
- Low trial-to-paid conversion
- Poor first renewal
- Weaker retention overall
3. Session length
Longer sessions can indicate engagement, especially for apps like video platforms or games, but they can also signal confusion or difficulty finding content.
For many subscription apps, efficient value delivery is more important than raw time spent. Context matters far more than total minutes.
4. Raw daily active users (DAU) or monthly active users (MAU) without a quality lens
DAU and MAU are only meaningful if ‘active’ reflects meaningful usage, and the frequency matches your product’s natural cadence.
A common recommendation is to look at the stickiness ratio that measures app stickiness:

However, there are two issues with this standard app stickiness metric:
- Your app’s ideal usage frequency might not be daily
- Active users’ often means ‘opened the app’, which isn’t the same as ‘experienced value’
Once you adjust for these factors, stickiness can still be useful, but it’s better to define your ideal usage frequency and compare it over a longer period to identify what drives retention.
For example, for a wellness app I worked with that offered workshops and meditations, consuming at least two pieces of content in 14 days was a stronger predictor of retention than using the app once a week.
How to test whether your activation metric is real or vanity
Defining an activation metric is just the first step. Next, you need to demonstrate that it reflects real activation, not just a vanity signal.
A metric only counts as true activation if it passes these tests:
1. Activated users retain significantly better than non-activated users
Compare retention curves for users who reached the activation milestone versus those who didn’t.
Think back to the diagram I showed earlier:
Hypothetical retention curves for two different behaviors in-app
You’re looking for a sustained difference, not a short-term bump that fades after a few weeks. If the curves reconverge later, the metric is likely just an engagement step, not true activation.
Put simply: if users who ‘activated’ don’t retain or pay significantly more, your metric isn’t real activation, it’s just noise.
2. The relationship holds across (most) cohorts and channels
Check whether the activation metric predicts retention consistently across:
- Cohorts over time
- Acquisition channels
- Web vs. iOS vs. Android
- Device types
- Geography (if relevant)
You don’t need perfection, as some variation is normal. You might see:
- A channel where the relationship is weaker
- Users on one platform are activating differently
What matters is that the pattern holds broadly, and you understand where and why it breaks. In some cases, you may need different activation metrics for web, iOS, Android, or different regions.
3. Improving the metric improves downstream outcomes
Some activation effects take time to appear in retention curves, especially if you’ve only recently started tracking them. Another key check is whether improving the activation metric drives the outcomes it should influence.
For example:
- If it’s an early value milestone → does it improve trial-to-paid conversion?
- If it’s a deeper habit milestone → does it improve first renewal?
- If it sits later in the journey → does it reduce early churn?
If the metric moves but nothing downstream improves, it may look meaningful, but it isn’t actually creating better, more durable users.
Practical checks to strengthen confidence in your metrics
If you have enough data, stress-test your activation metrics with a few deeper cuts:
- Compare activated vs. non-activated users within the same cohort
- Split by paid vs. free users (if you have a freemium path)
- Break down by channel or device quality
- Check whether high-LTV users follow the same activation pattern
This helps you avoid building your activation model around users who were never likely to pay or retain in the first place.
Work out your activation window
Activation is not just about what happens; it’s also about when it happens.
Look at your retention curve and identify where the steep early drop-off stabilizes. That point often marks the transition from activation to retention and helps define the window where your metric truly matters.
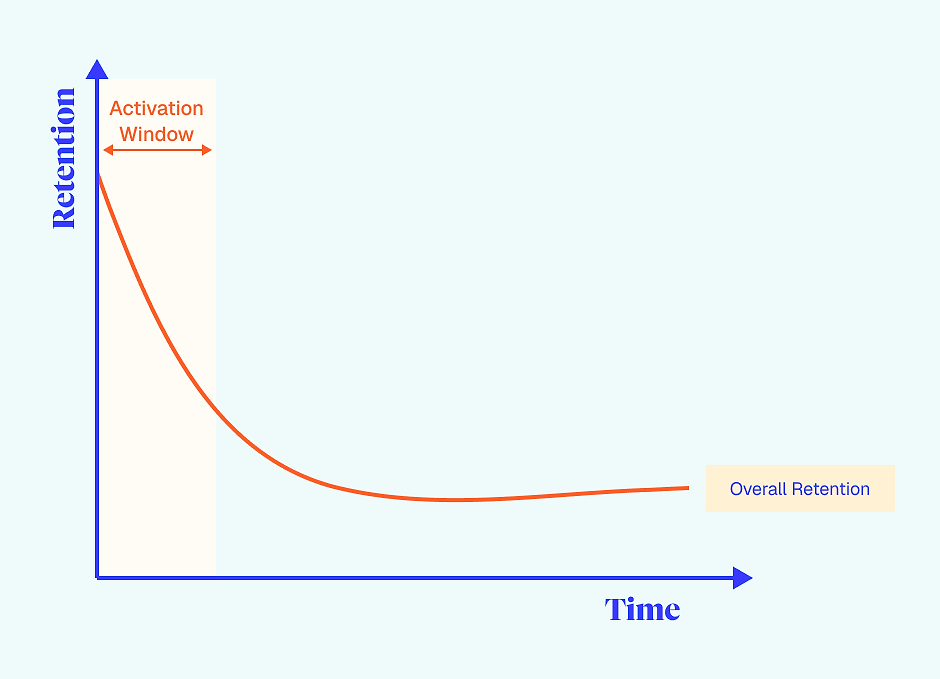
If the activation window is very long, it may indicate that users aren’t deriving value quickly enough, or that your product simply requires a longer window to activate. This could mean:
- Users aren’t reaching value fast enough
- They need more guidance or support to progress meaningfully early on
Back to a language-learning app, a single lesson isn’t enough to signal commitment. Users may need to complete several lessons over a week or two before they meaningfully engage as long-term learners (or start fearing the owl enough to keep going). The window isn’t just about capturing that first lesson; it’s also about the time required to significantly increase the user’s likelihood of staying.
The goal isn’t to force activation sooner than makes sense. It’s to understand when it happens today and whether that timing supports retention.
How to use this in practice
After all that, you might have a long list of metrics you could track, but you don’t need dozens. Stay focused by categorizing metrics into three clear buckets.
- Metrics that matter shoulddirectly predict conversion, retention, or renewal: optimize these
- Metrics that inform help you understand why activation is or isn’t happening: investigate these
- Metrics that distract are easy to improve, but often optimize volume over quality — keep an eye on them, but resist chasing them
If there’s one takeaway, it’s this: activation is not about getting users through steps. It’s about helping the right users reach value in a way that makes them likely to stay.
When teams think they have a retention or monetization problem, it’s often because activation never truly happened. The earlier you define what real activation looks like for your product, the easier everything downstream becomes.