
Summary: Meta UA campaign performance can be improved by using a high-velocity creative testing framework that separates proven ads (BAU) from experimental creatives. This structure enables rapid iteration, controlled delivery, and reduced cost per trial (CPT) without sacrificing trial-to-subscription conversion. Key tactics include ICE scoring, 10,000-impression thresholds, and placement monitoring to maintain targeting accuracy and algorithm efficiency.
At this point, we all know that targeting in your UA campaigns is done through creatives, not through audience settings (I think I’ve even repeated this sentence in some of my articles already).
And although you can still achieve success with narrower audiences, you’ll eventually hit a ceiling when you try to scale. In this case, if going to broad audiences allows you to grow, having a good set of creatives and enough creative testing volume becomes the key that unlocks profitable scale.
In this article, I’ll show how a high-velocity creative testing framework helped me scale a subscription app with Meta campaigns – while driving the cost per trial (the event we optimized for) to a level they hadn’t reached even with lower spend.
What was the situation before I took over?
Before explaining how to create this framework to accelerate your creative testing and generate positive growth for your app, let me tell you that having a good product that converts well is key. In this case, this subscription app was offering a 14-day free trial that worked well during the previous year but was struggling to grow in the first half of this year.
With such a long free trial, we couldn’t optimize for subscriptions directly—the attribution window on most ad networks maxes out at 7 days post-click. So we used free trials as our proxy event. Our goal: scale spend while lowering cost per trial (CPT), without hurting the conversion rate from trial to subscription.
Right now in most ad networks, decreasing the CPA of a proxy event like trial isn’t hard. You simply need to build the creative framework that we’re going to explain in this article (or something similar) and also have a daily budget that feeds the algorithm with constant, quality signals (what Thomas Petit recently described as signal engineering).
However, there’s an important catch in this process.
Lowering the cost per trial often comes from targeting younger audiences that have lower purchase intent, which usually hurts the final subscription conversion rate – and remember, we couldn’t affect this CVR if we wanted to achieve profitable growth, so we had to keep targeting our core audience (primarily men over 45).
I’ve seen this pattern of Meta optimizing towards upper-funnel events repeatedly, and if you don’t keep an eye on the age and placement distribution of your campaigns, you will end up worsening your overall ROAS, although your cost per trial goes down.
This means that, apart from creating the framework for the creatives, we also had to monitor the delivery of our campaigns constantly to be sure that our target audience was still the main objective for our new campaigns and creatives.
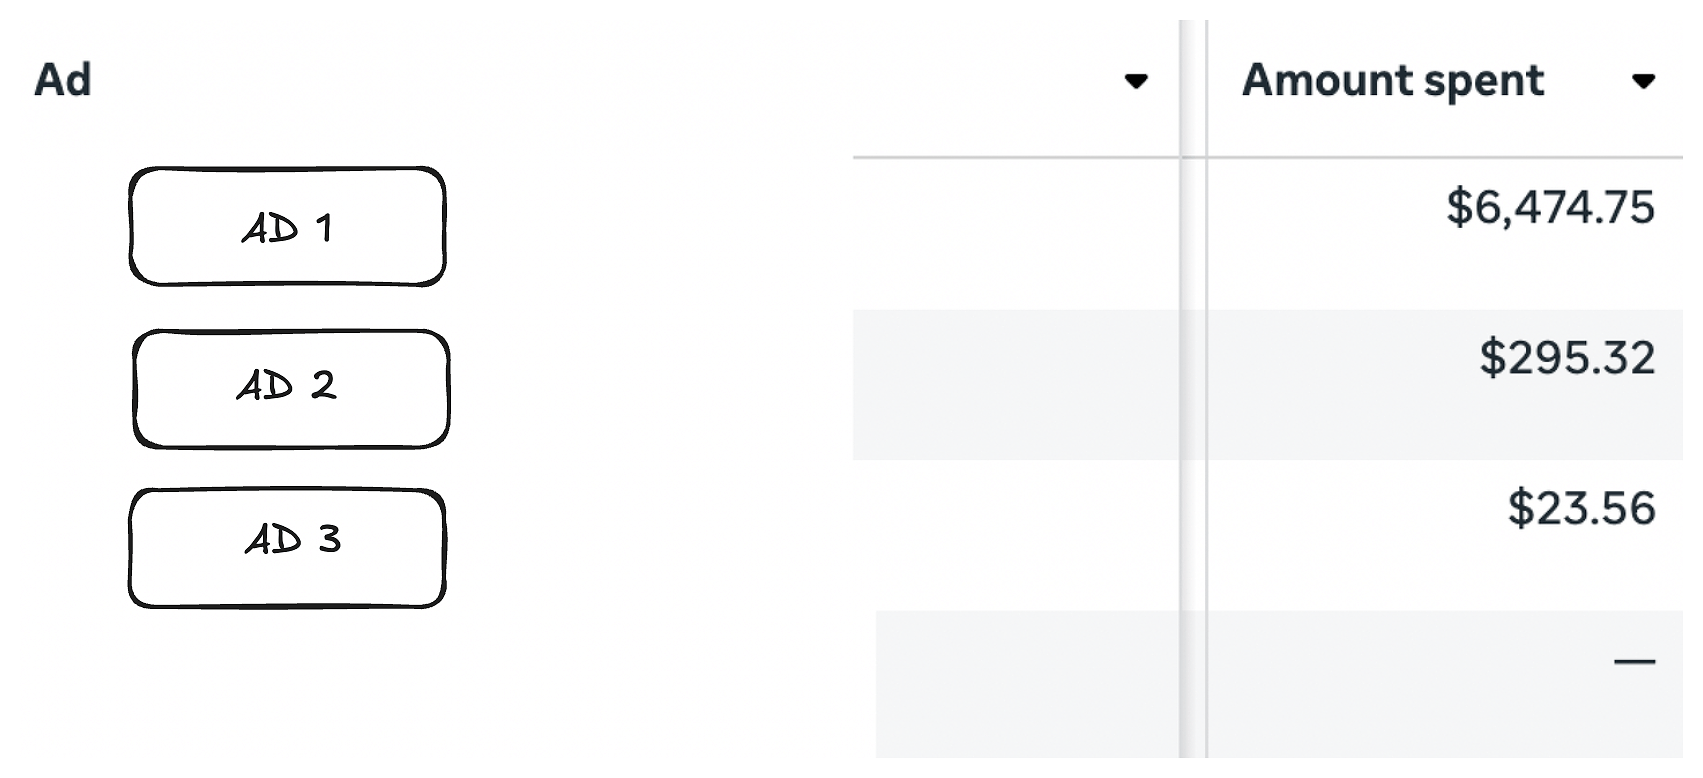
With all that being said, it was time to check the campaigns, and what I found is also one of the problems that many UA managers face in Meta ads: only one creative from the few they had was gathering most of the impressions and spend.
Does it sound familiar to you?
Well, this is just Meta optimizing towards one creative simply because the algorithm finds better upper-funnel metrics on it (CTR, hook rate, hold rate) than other ads.
We had a bunch of new ads ready to test and scale, so we had to create a new strategy that could prevent us from such a situation while we also scaled the app under the conditions I explained above. So we simply changed the campaign setup.
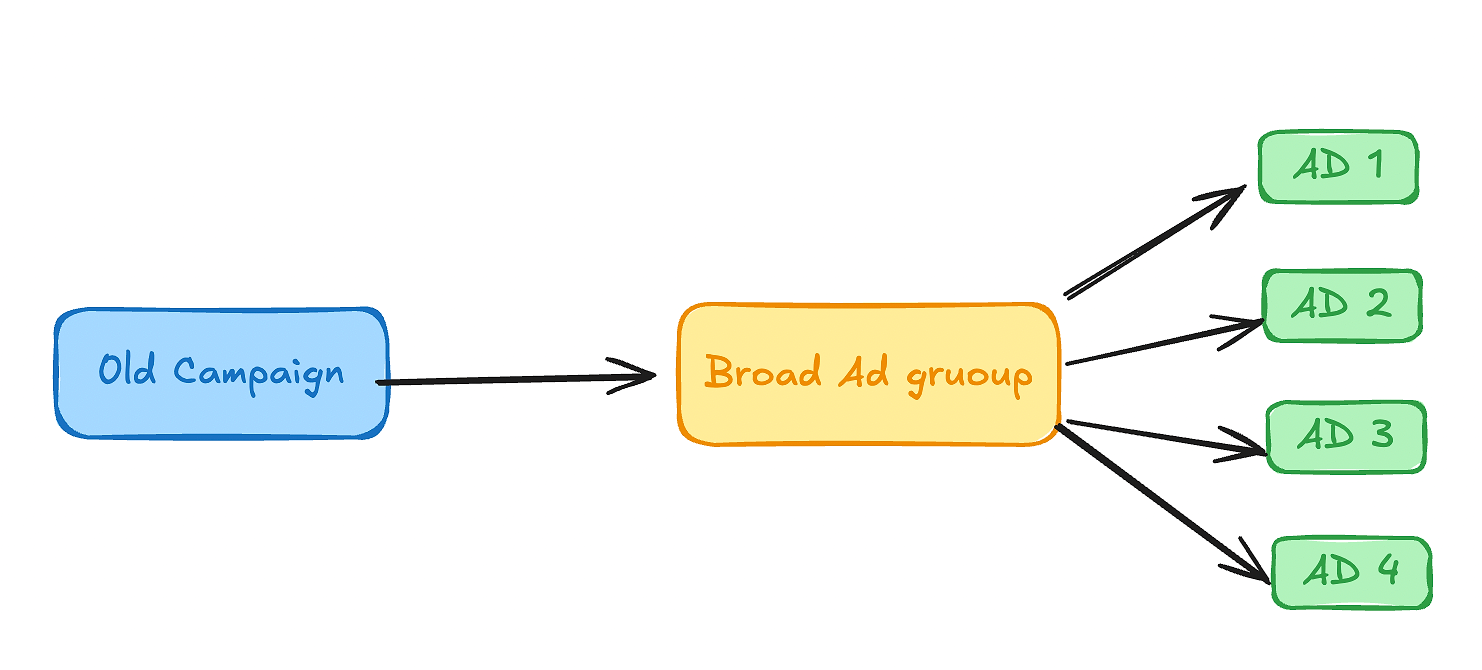
Here’s what the original setup looked like. They were relying on Meta’s algorithm to choose the top-performing creative. This can work for smaller apps with tight budgets if you rotate ads regularly and keep a close eye on CPA and targeting.
How to create a high-velocity creative testing framework to scale your app
When you have the resources to create new assets continuously and your goal is to scale through profitable growth, you need a setup that allows you to move fast with both variables: creatives and budgets. With this in mind, I built a new structure to support them both:
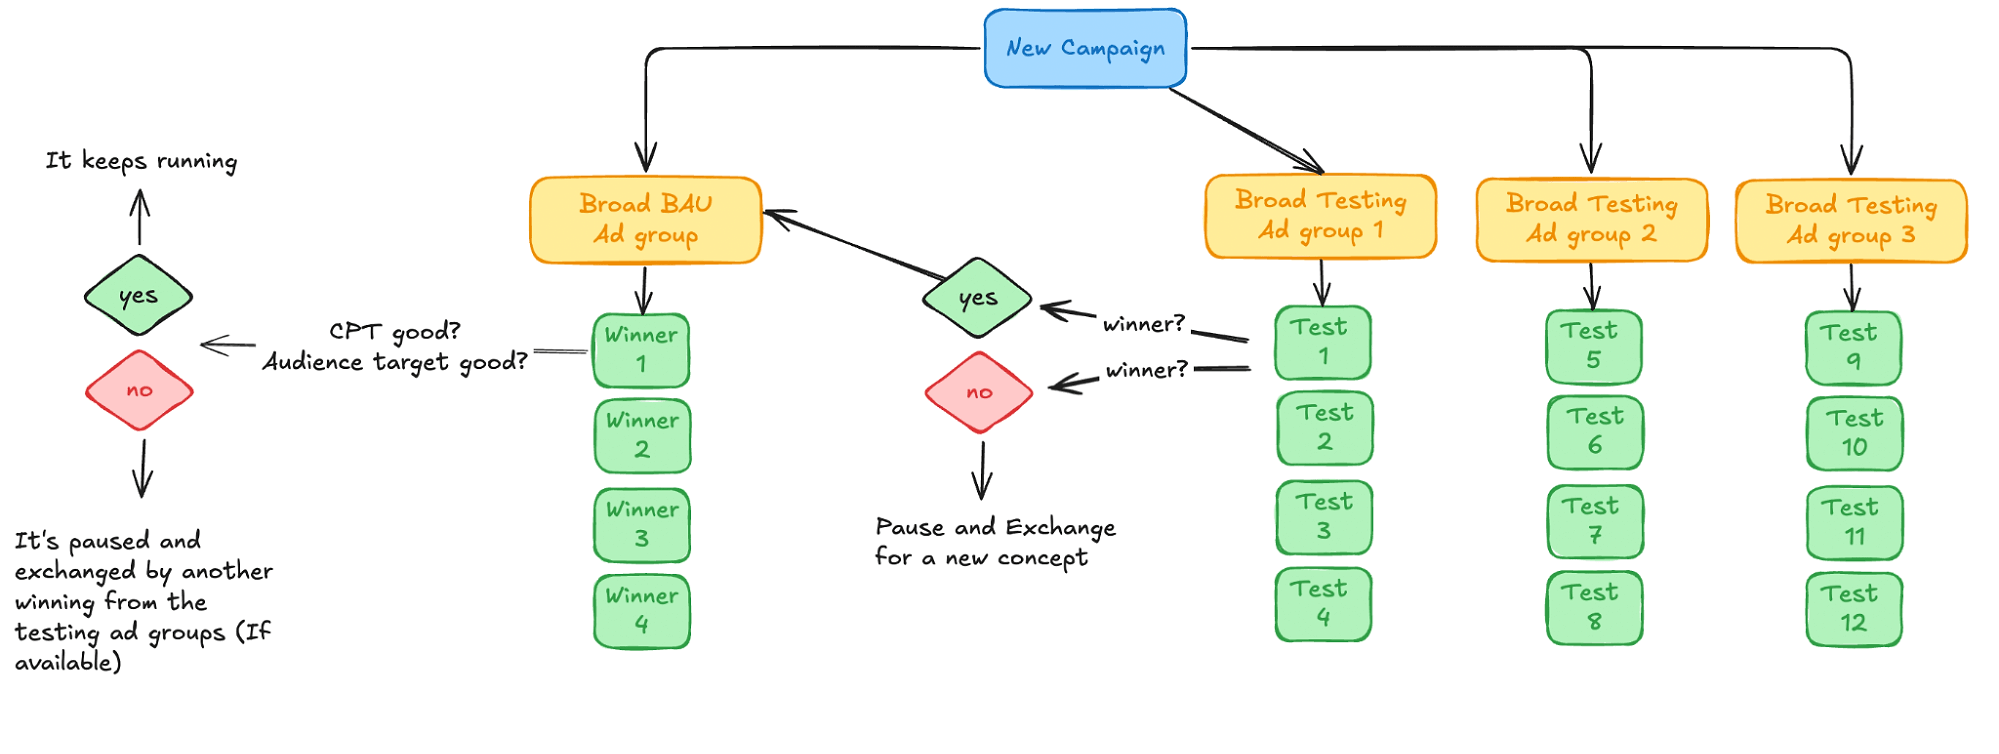
With this setup, instead of relying on the algorithm to pick the creative, we had control over everything: data, creatives, budgets, and testing velocity. The functioning of this setup was quite straightforward:
- We created one “winning” ad group with all the winning assets that they had detected before I joined. This ad group had the majority of the budget, as we already knew that the creatives were producing a good cost per trial and they also targeted our audience segment efficiently (so our conversion rate from free trial to subscription was not affected negatively).
- We created 3 testing ad groups which always had different creatives. The goal of this ad group was always to nurture the BAU ad group with new winning ads and also to serve as the engine of the high-velocity creative testing framework. The more budget we could put on these ad groups, the faster we could test new variants.
The day-to-day management of such a setup was simple:
- We checked the BAU ad group and monitored the cost per trial. If CPT was 20% above baseline during the last 2 days, we paused that winner and put a new winner from the testing ad groups.
- We checked every testing ad group, and if CPT was on the baseline or slightly better and it was targeting our target audience after achieving at least 10,000 impressions, we moved it to the BAU ad group if there was any slot available. If not, the creative was in reserve until a new slot was available. (In these cases, you can add more BAU ad groups with more winning assets if you have more budget, but that was not our case, so we had to go a bit slower – that’s why I always say that velocity depends on the size of your pocket mostly.)
- If any of the creatives within the testing ad groups were not receiving spend after being active for 2 days or had a bad cost per trial during the same period, we simply paused that creative and uploaded a new one.
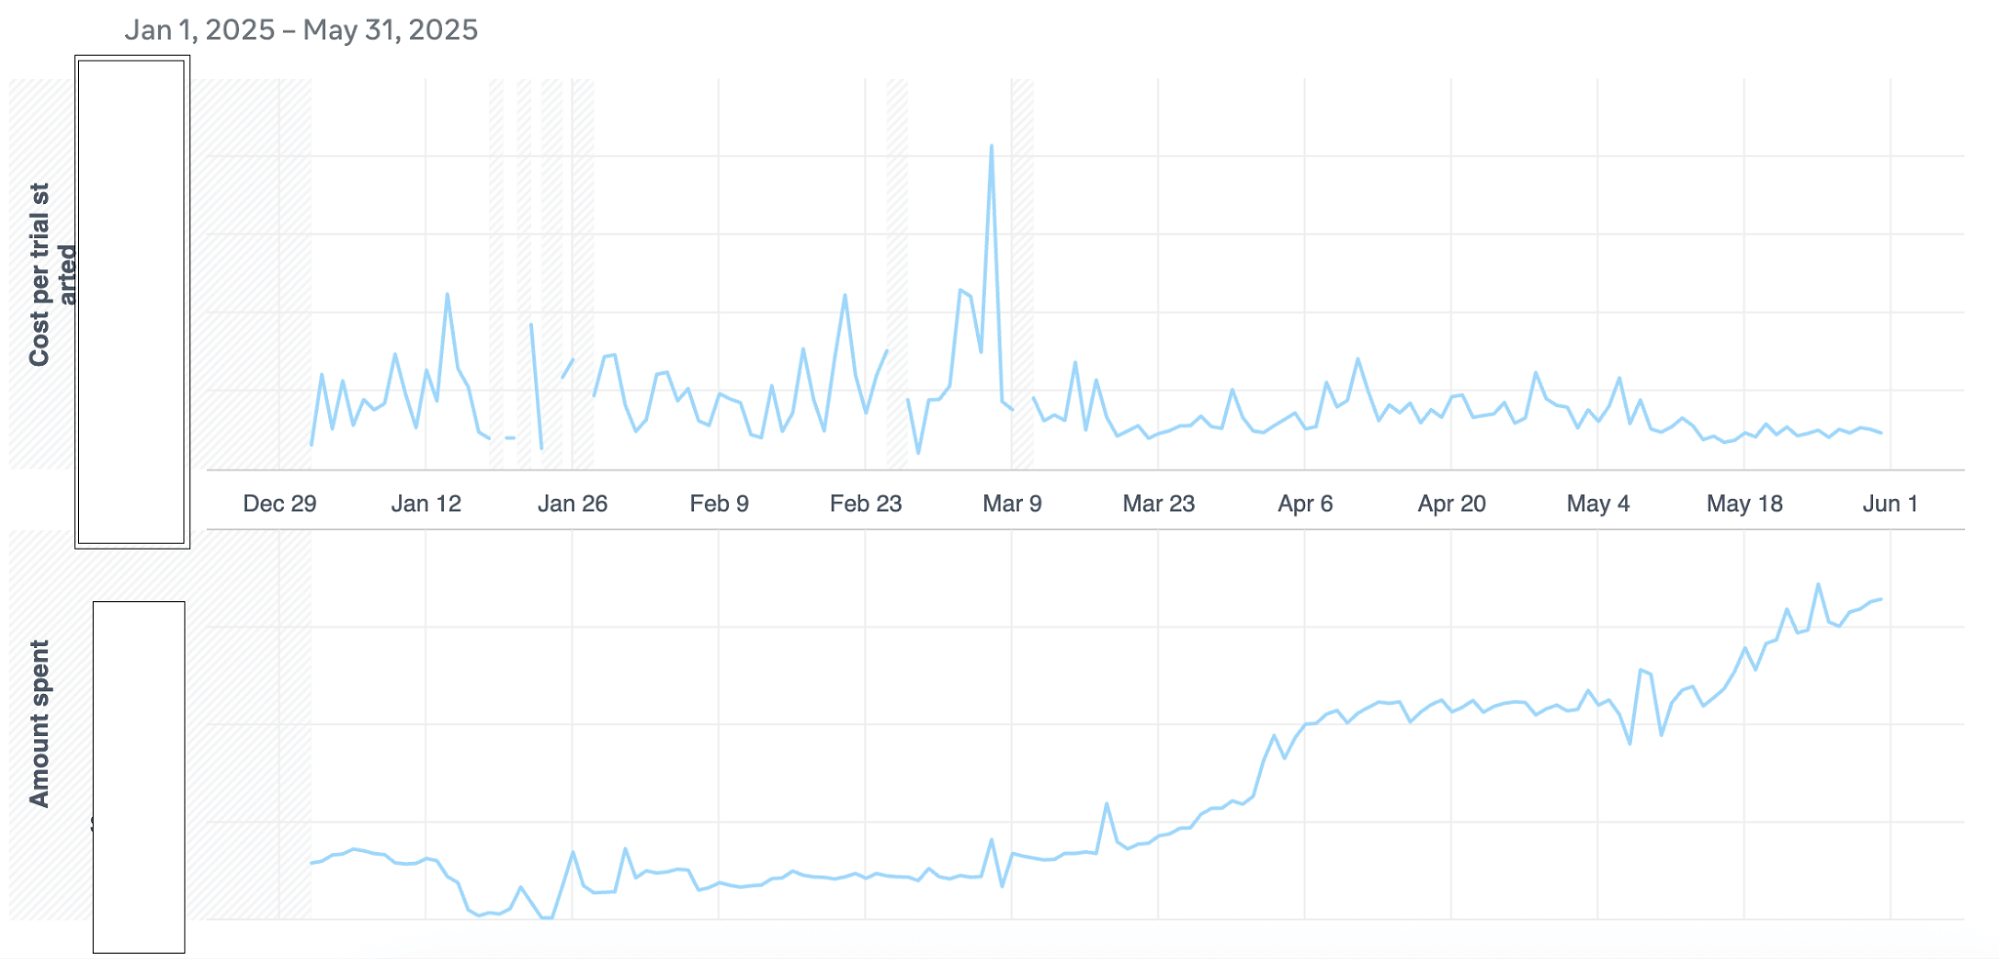
With this setup, we were able to test 30+ creatives and to detect at least 2–3 winners per week. This allowed us to scale the BAU ad group and generate the trend that you can see in the beginning of the article: scaling the spend while we decreased the cost per trial.
And the most important part is we drastically changed the placement distribution with this setup:
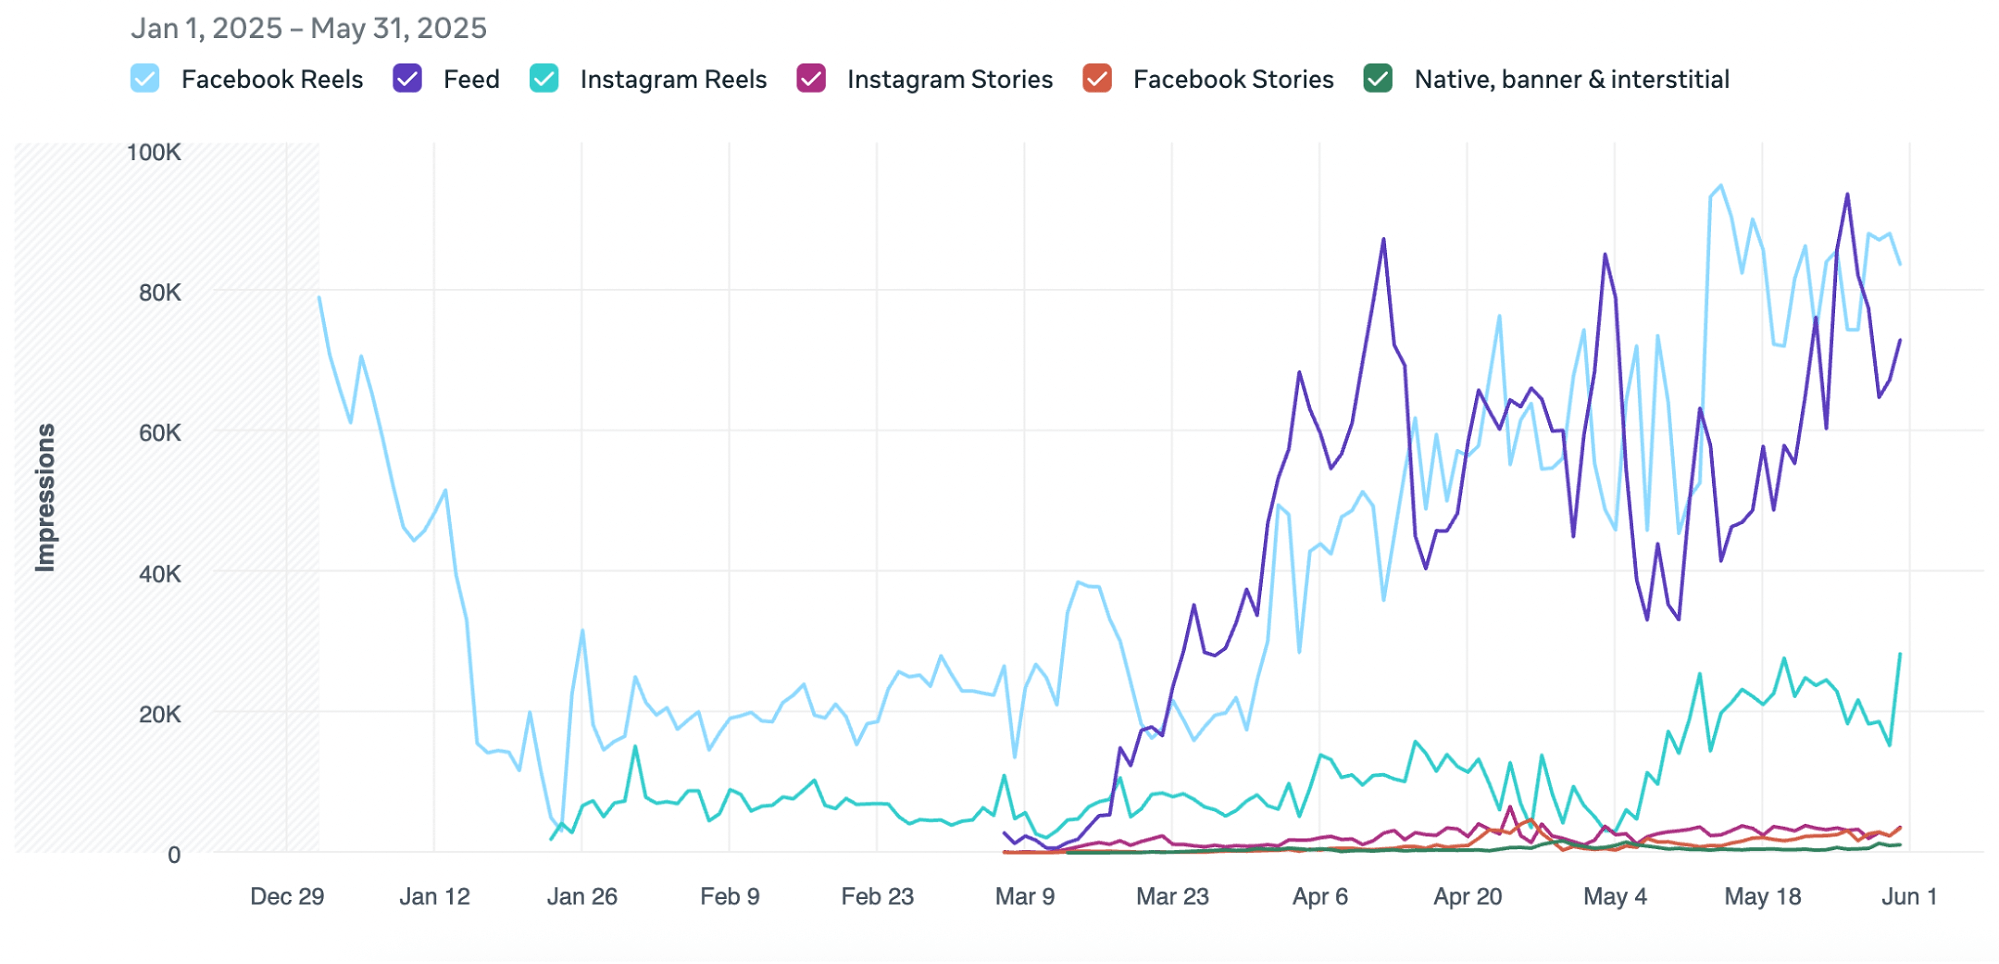
The biggest win: placement distribution
This was, without any doubt, the biggest win of the whole strategy: all our money started to be spent in the placements where our core audience spent time in social media – Facebook – and that allowed us to:
- Decrease the cost per trial by 29%
- Increase trial-to-subscription conversion by 2%
Obviously, apart from iterating the campaigns as explained above, we were continuously monitoring how the conversion rate from free trial to subscription was performing for every single daily cohort. This was completely necessary to be sure that the campaign data was actually confirming our hypothesis about the correlation between the placement and the purchase intention of our users.
Managing creatives: how the system runs
Once we had the setup in place, we needed a way to analyze, iterate, and manage creatives on a daily basis.
The rules for moving creatives between groups were simple:
- Cost per Trial needs to be equal or better than the baseline after achieving 10,000 impressions (just to be sure that performance is sustained by solid data)
- The placement distribution of that creative must be clearly focused on your target audience (in my case, Facebook)
With these two conditions, we created a spreadsheet where we tracked the status of the creatives and their performance. Every time that we found a winner, we created a new tab within the spreadsheet to work on some iterations that could work as new winners:
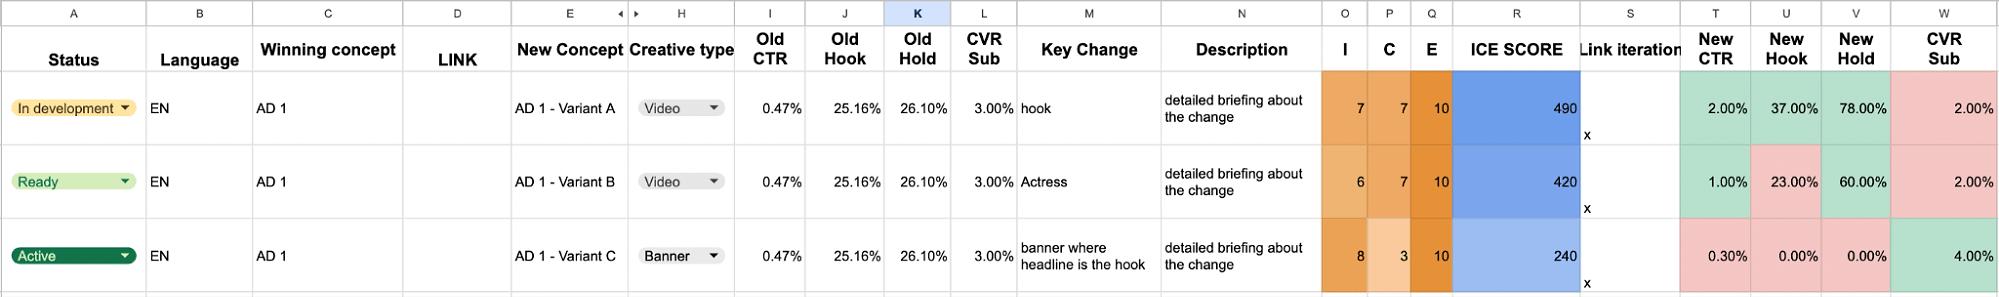
As you can see, each winner could have multiple iterations. We normally produced some iterations completely from scratch, some were generated by ChatGPT, and others were inspired by looking at the competitors. It doesn’t matter how: the important thing here is to produce enough iterations of the winner to be completely sure that you milk that concept to the maximum.
Once we had some ideas to iterate, we just filled out the template – as you can see in the screenshot. In this case, apart from the generic information about the name of the ad, language, format, etc, we had to fill out an ICE SCORE for each iteration according to our experience with other ads.
Putting an ICE SCORE was crucial to prioritize the order of the creatives and it actually worked as a filter when one spot was available in the BAU ad group. Thanks to this system, scalability was achieved even faster because the iterations with more potential were run before other iterations, feeding the whole system with more potential winners at a higher pace.
Once we tested the iterations, we also put the main engagement metrics next to the iteration and compared them with the metrics of the original winning asset. With this quick analysis, we were able to see if the ideas we were developing were actually having the effect we were hoping for.
For example, if we had an iteration where the main change was the hook, we expected that the hook rate in that iteration would be higher than in the original winning asset. Or if we changed the content of the video to retain more users, we expected to have a higher hold rate than in the winning concept.
Conclusion
With this well-structured framework, you can really nurture your campaigns with the best assets possible, giving the algorithm the right conditions to hit your CPA goals.
Of course, this process takes time and constant analysis across your campaigns, creatives, and product. But if you have the resources to implement it, your chances of achieving profitable growth go way up – just like they did for this company.
As I mentioned above, the more budget you have, the faster you can move with the testing. In our case, we were limited to one BAU ad group, but if you have higher budgets, you can run multiple BAU and testing groups in parallel, giving you more slots to scale and test every day.
I hope this case study gives you a few ideas to test and maybe a faster way to scale profitably!