The subscription app market has never been more competitive — monthly app launches have grown sevenfold since 2022, and the window to prove value is shrinking. For developers relying on annual plans as their primary revenue engine, the stakes have never been higher: new data from RevenueCat’s State of Subscription Apps 2026 report reveals that when annual subscribers cancel, 95% never come back — and most of that churn is concentrated in the first month.
The findings challenge conventional assumptions about where developers should focus retention and win-back efforts. Annual subscribers are the most valuable upfront but the hardest to recover, while monthly subscribers — often treated as lower-value — return at four times the rate, pointing to a structural reactivation opportunity most apps are underweighting.
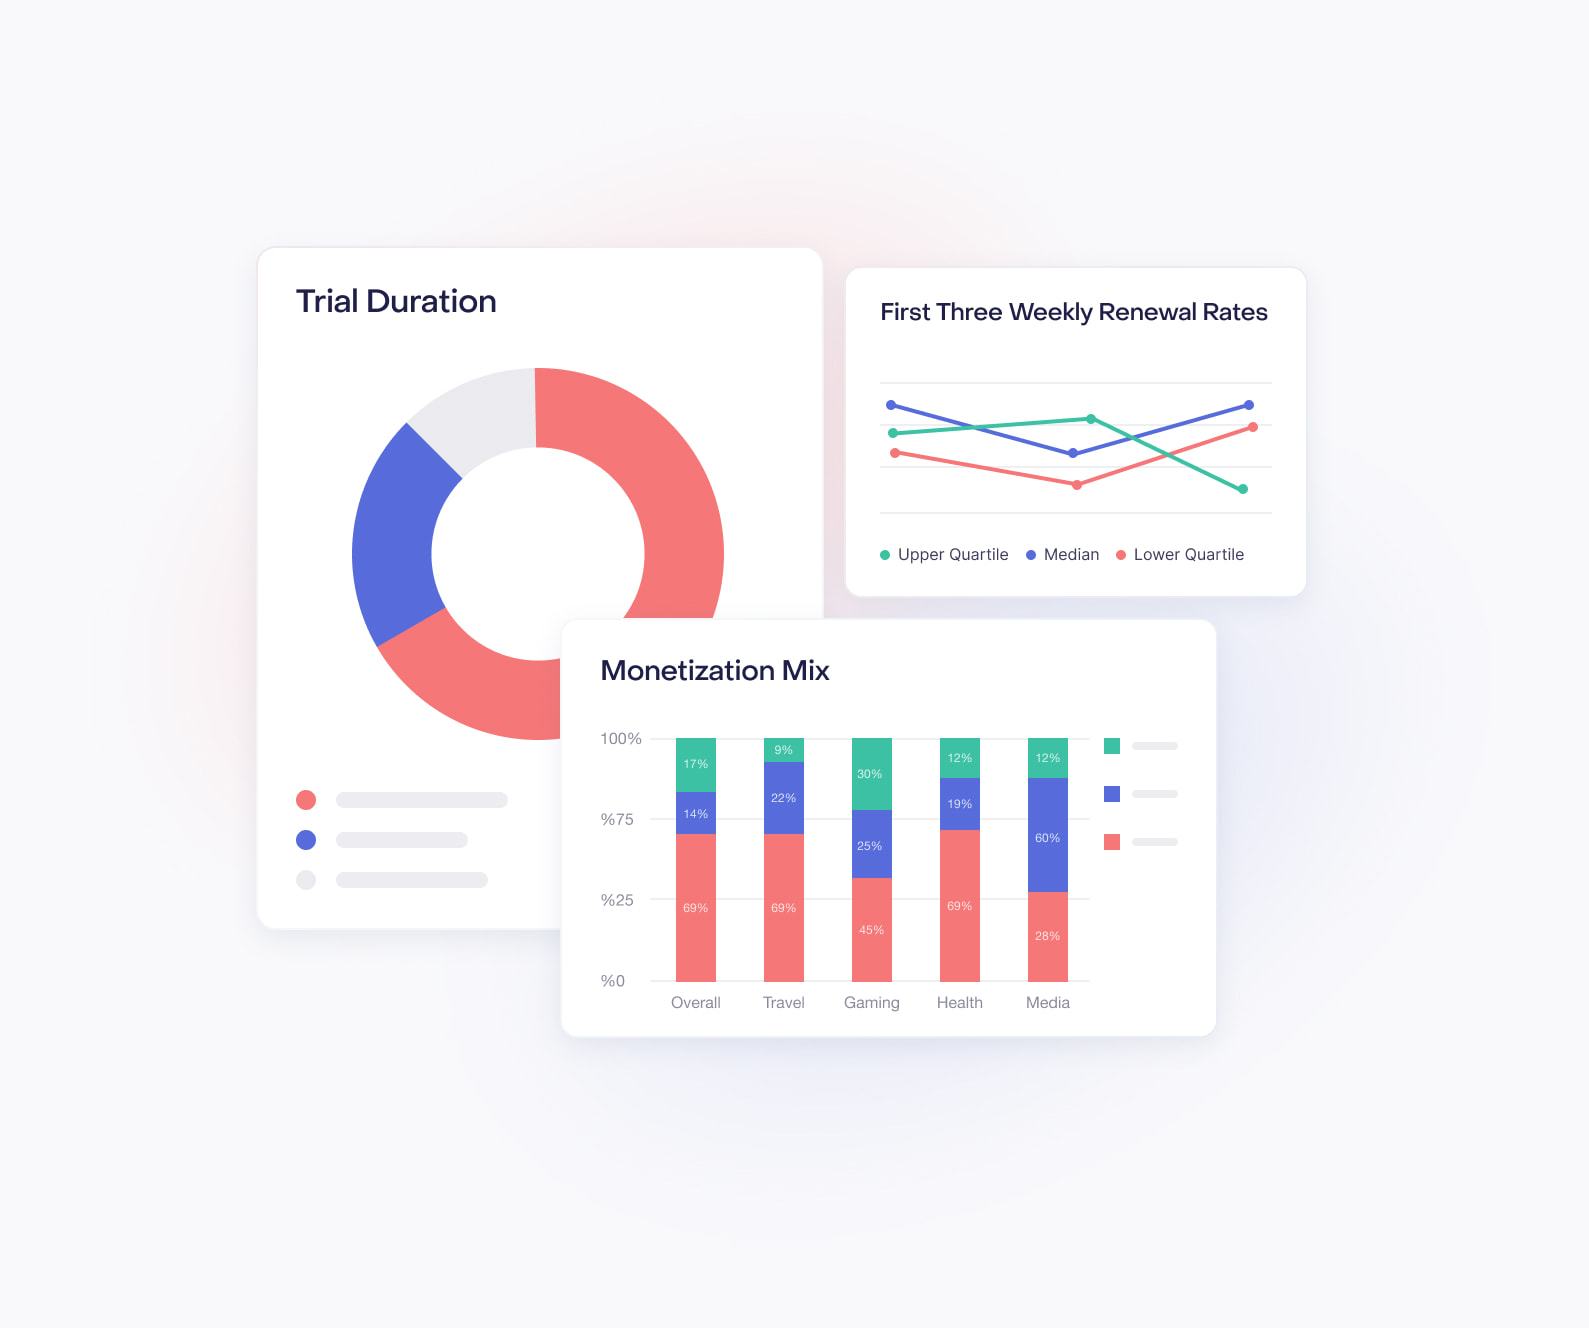
RevenueCat set out to determine what sets the highest performing apps apart from everyone else, examining considerations from revenue strategies and popular app categories to the pricing architectures that drive retention and performance. The State of Subscription Apps looks at data from over 115,000 apps across all app categories, covering more than $16 billion in revenue.
Annual cancellations follow a distinct pattern — Month 1 is the starting point.

Key insights
- Month 1 accounts for 35% of all annual cancellations overall, ranging from 23–50% by category. Shopping’s Month 1 share (~50%) is roughly 20% higher than Education (~30%).
- Cancellations decay to ~5% per month mid-year (Months 3–11: 3–7% each) before Month 12, when renewal approaches and apps see a second spike of 9–14% across every category.
- With reactivation structurally capped regardless of region or price, the cost of losing a subscriber in that early window is effectively permanent.
Users are deciding faster — more than half of trial cancellations now happen on the first day.

Key insights
- 55.4% of 3-day trial cancellations happen on Day 0; 39.8% of 7-day, 35.7% of 14-day, and 31.1% of 30-day trials are also cancelled on Day 0 — a clear sign that the trial decision is increasingly made within hours of starting.
- 84% of 3-day trial cancellations and 64% of 7-day trial cancellations occur between Day 0 and Day 1, leaving developers a much narrower window to demonstrate value before users disengage.
Annual reactivation sits at just 5%, and barely moves — monthly subscribers come back at 4× the rate.

Key insights
- Annual reactivation sits at just 5% overall and 3–8% by category. By contrast, 20% of churned monthly subscribers reactivate within a year, ranging from 6% to 36% depending on app category.
- Productivity apps — a space increasingly led by AI tools — see the highest monthly reactivation at 36.1%, reflecting users who cancel when they don’t need the tool and return when they do.
- Annual churners made a deliberate, considered decision to leave — and the data across every category reinforces that they very rarely reverse it.
Annual subscribers are also the most valuable upfront

Key insights
- Yearly plans renew at 83.4% overall — more than 4× weekly (18.7%) and roughly 2× monthly (39.2%). Across every category, yearly retention materially outperforms shorter durations.
Annual subscribers who stay become highly committed.

Key insights
- 1st annual renewal rates land at a median of 23–40% by category, climbing to 44–64% (2nd renewal) and 56–70% (3rd renewal) — meaning subscribers who clear the first hurdle become highly committed.
- Productivity has the lowest 1st annual renewal at just 23%; Business leads at 40% — the 12-month window creates more churn opportunities than weekly or monthly plans, where 1st renewals run 53–61%.
Monthly reactivation holds across borders — the win-back opportunity is structural, not regional.

Key insights
- Monthly plans drive reactivation rates of 18–24% worldwide — from North America (18.0%) and Western Europe (21.7%) to Asia-Pacific (23.9%). Annual plans cluster narrowly at 4.9–5.9% across every geography.
- Geographic variance is surprisingly narrow; reactivation behavior is more universal than acquisition or retention metrics, suggesting churn dynamics are tied to plan type rather than market context.
Price doesn’t change the outcome for annual churners.

Key insights
- Even among high-priced apps — where the subscription cost is most salient — annual reactivation reaches only 4.4%. At the same price tier, monthly reactivation is 28.9%, a gap of nearly 25 percentage points.
- Annual reactivation clusters at 4.4–5.6% across every price tier; monthly ranges from 12% (mid-priced) to 29% (high-priced). The shape of the gap is consistent regardless of how much subscribers paid.
- High-priced annual churners are truly lost; they made a considered decision and won’t revisit it.
First-year annual retention is also slipping.

Key insights
- First-year annual retention fell from 31% to 28% year-over-year. Monthly retention dropped from 10% to 8%, and weekly from 1.7% to 1.2%.
- For apps relying on annual plans, fewer subscribers are converting to annual in the first place — and fewer of those are staying through the first renewal.
- To avoid a surplus of lost users, developers need to intervene before cancellation, not after. With annual reactivation structurally capped at 5%, strategies should focus on early retention and frictionless return — e.g., giving users an option to pause instead of cancel, which maintains the relationship without forcing re-entry of payment information.