
Summary: Ad fatigue in 2025 can be identified through early signals like declining CTR, rising frequency, onboarding drop-offs, and cross-channel performance shifts. Reliable detection methods include tracking saturation curves, analyzing SKAN 4.0 anonymity tiers, monitoring blended ROAS and subscription rates, and using proxies like Custom Product Page (CPP) performance and App Store referrer data.
With ad creative lifespans shrinking and signal loss making performance harder to read, spotting ad fatigue early has never been more critical — especially for subscription apps. A slight delay in refreshing underperforming assets can compound into real revenue loss.
This article explores advanced techniques for detecting and combating ad fatigue, leveraging multiple data sources, including SKAdNetwork (SKAN), onboarding flows, and conversion patterns to predict when your ads are losing their impact before it’s too late.
What is ad fatigue?
Ad fatigue occurs when users become desensitized to ads due to excessive exposure, resulting in decreased engagement and reduced overall effectiveness.
According to a study by Simulmedia, people who saw an ad 6-10 times were 4.1% less likely to buy a product than those who saw the ad 2-5 times. This highlights the delicate balance marketers must strike between ad frequency and effectiveness.
However, the challenge relies in finding the right timing to stop, add, and prioritize the budget allocation to new assets that could generate a higher return on investment.
📚 Need a primer on why creative fatigue happens in the first place?
Check out David Vargas’s post on how ad platforms accelerate fatigue — especially when they over-optimize for early wins. This post builds on that with early-warning signs to act before your ROAS drops.
Detection methodologies
Cross-channel correlation
One powerful approach is to analyze cross-channel correlation, using the performance on specific ad networks as a proxy for creatives running across multiple channels. In practice, this means if you run the same ad creative on different platforms (e.g., Meta, TikTok, Google UAC, Snap), trends on one network can foreshadow performance on others. Marketers can predict ad fatigue by identifying leading indicators on a platform that saturates faster or has a more sensitive audience.
For example, consider a subscription fitness app with a successful video ad on Facebook and TikTok. They observe the following on TikTok:
- Click-through rate (CTR) has steadily declined over the past week.
- Ad frequency is increasing.
The younger audience and fast content cycle on TikTok may lead to faster creative wear-out. This early CTR drop on TikTok can indicate that the same creative might soon underperform on Facebook, assuming the audience age is similar. Even if Facebook installs or conversions haven’t decreased yet, the TikTok trend provides an early warning to:
- Refresh the creative.
- Act before a performance decline impacts Facebook’s larger ad spend.
Apply this technique to spot patterns like:
- Rising CPC/CTR on one channel: If the cost per click suddenly spikes on Google App Campaigns for a given creative, it might indicate the audience that finds it appealing is tapped out. That same creative running on another channel could be close to hitting the wall as well.
- Conversion rate decay: A drop in install-to-trial conversion rate on Network A for Creative X (perhaps due to users seeing it too often and ignoring the call-to-action) may predict a similar drop on Network B soon after.
- Time-lagged trends: By measuring the time lag between performance peaks and declines on each channel, you can create a “fatigue map.” For example, you might find that a creative tends to peak on Facebook and then peaks on smaller channels like Pinterest one week later. That means Pinterest could serve as an early warning system for creative wear-out that will eventually reflect on Facebook.
Pro Tip: Create a data pattern. For example, a mobile meditation app observed that when a particular calming ad creative reached ~2 million impressions on Instagram, its daily subscription trials from Facebook (where the same creative ran) began to decline, despite steady spending. The research showed that the Instagram audience saturated first; many in that audience also use Facebook. Seeing Instagram engagement drop off alerted them that the creative was “tired.” They preemptively rotated in a new creative on both platforms, avoiding deeper drops in acquisition
Onboarding flow
Sometimes the clues of ad fatigue appear within your app’s onboarding flow rather than in the ad metrics themselves. In other words, by examining how new users behave after clicking an ad and installing, you can infer if those ads attract the proper attention or if users are arriving under pretenses (often when an ad grows stale or overexposed).
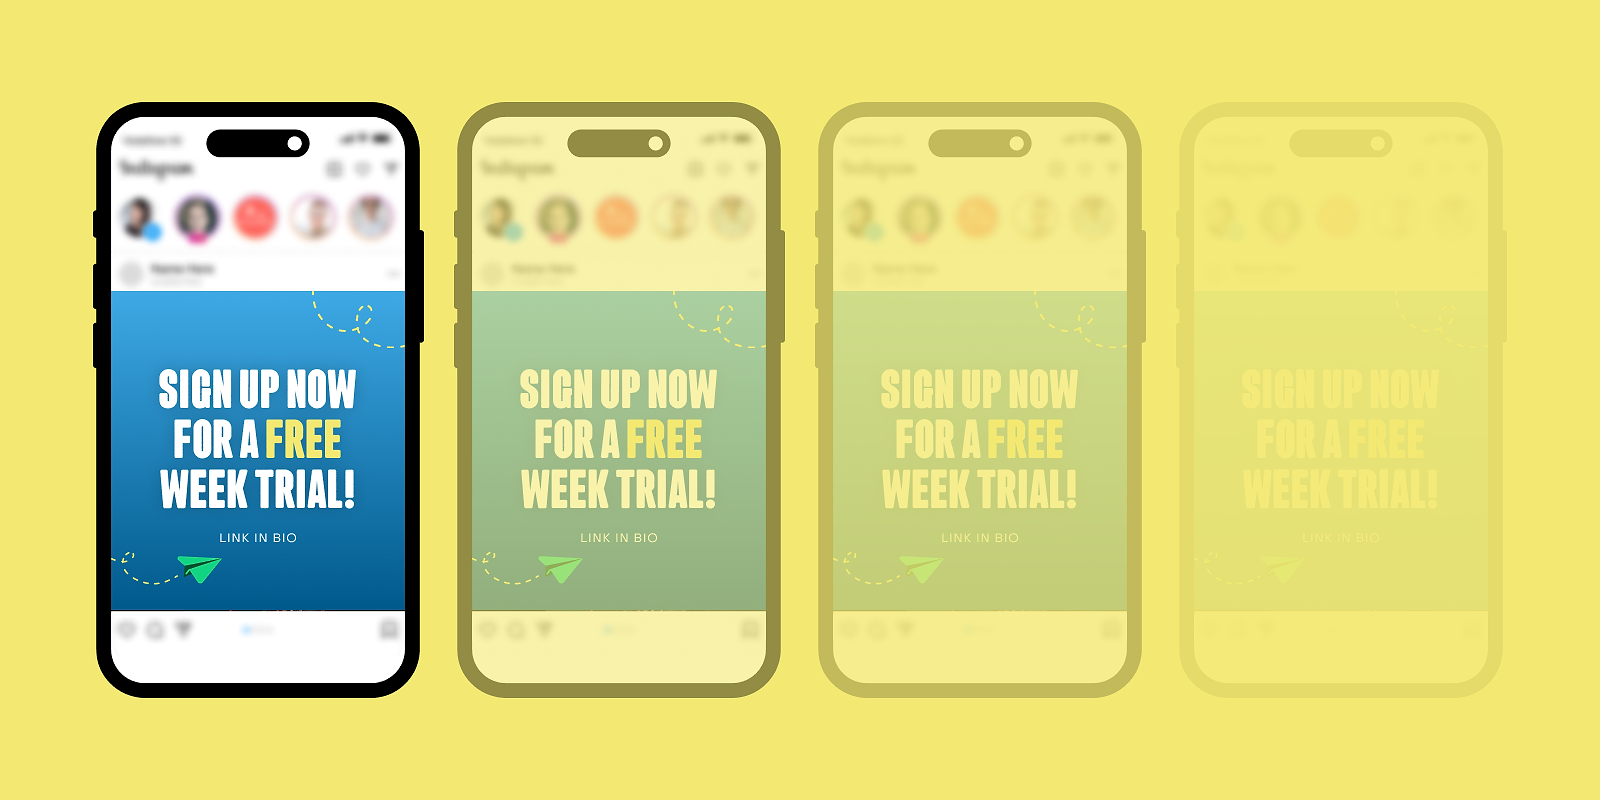
Leveraging onboarding metrics and qualitative inputs during user sign-up can help identify trends related to ad fatigue. One clever tactic subscription apps use is adding a “Where did you hear about us?” question in the onboarding process. This optional survey screen can capture whether users recall seeing an ad and on what platform.
Example: Language learning app
Classic signs of ad fatigue:
- Typically, 40% of new users report hearing about the app from “Instagram Ads.”
- In the last two weeks, this has dropped to 25%.
- More users are now selecting “Friend/word of mouth” or “App Store search.”
This shift could indicate Instagram ads are becoming less effective due to ad fatigue, meaning:
- Fewer people are clicking the ads.
- Those who do click don’t find the ads memorable or impactful.
If Instagram ad spending remains constant, this decrease in self-reported attribution suggests:
- The ads are less memorable.
- The ads are less engaging than before.
Onboarding drop-off as a fatigue signal
If a formerly strong ad campaign is now delivering users who abandon onboarding at higher rates, it could be because the ad is attracting less qualified or less enthusiastic users. These users may have seen the ad multiple times and clicked out of boredom or annoyance rather than genuine interest.
Example: Productivity app
- Users coming from its long-running YouTube ad (showcasing a to-do list feature) used to have a 50% onboarding completion rate.
- Now, only 30% of users from the same YouTube ad complete onboarding.
- Users from a fresh TikTok ad are still at 50% completion.
The drop in onboarding completion from the YouTube ad suggests:
- The appeal of YouTube creatives has faded.
- People click the ad but don’t find the app compelling enough to finish onboarding.
- The ad might have over-promised or simply no longer resonate.
This significant drop is a strong indicator of creative fatigue, suggesting it’s time to:
- Refresh the YouTube video.
- Replace it with new messaging.
In summary:
- Monitor onboarding completion and early conversion rates as a real-time pulse check on ad performance.
- A sudden dip in quality or engagement of new users often signals creative fatigue or excessive ad frequency.
- Link onboarding metrics to their acquisition sources (campaign, network, creative ID) to pinpoint under-performing ads quickly.
- Act fast: refresh creatives or rebalance spend the moment onboarding data shows a sustained decline.
Saturation curves
Another advanced technique to detect when creatives are wearing out is to chart saturation curves for your campaigns. Saturation curves visualize how performance metrics change as spend or impressions accumulate, helping pinpoint the inflection point where returns diminish – essentially showing when an ad has hit audience saturation.
In real-world terms, especially for subscription apps, these curves can be invaluable for knowing exactly when a creative has given you all it can, and pushing it further only yields fatigue.
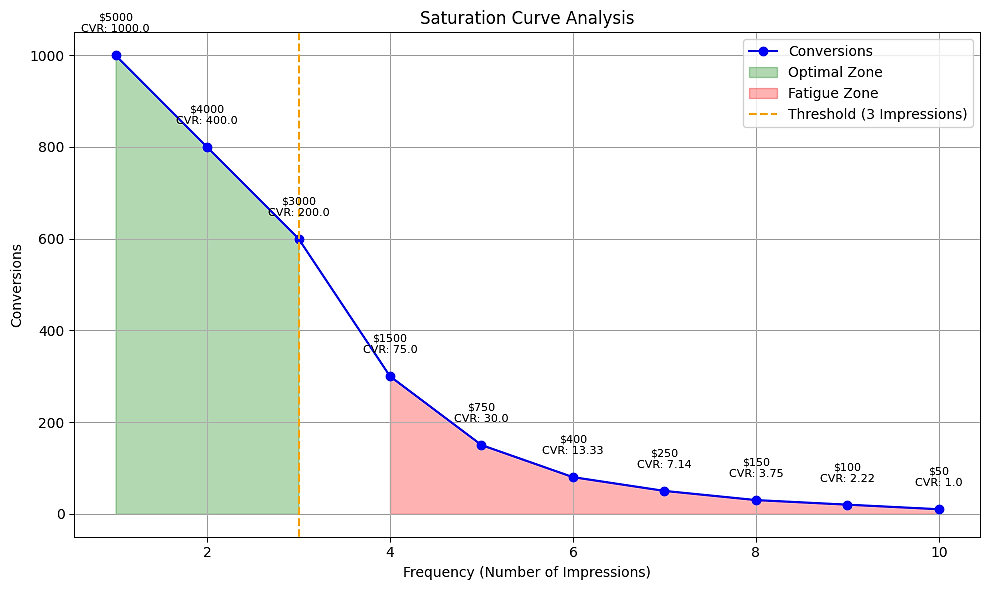
What is a saturation curve? It’s typically a plot of an outcome (like conversions, installs, or revenue) versus an input (often spend or impressions). Early on, as you increase spend, conversions also increase – but beyond a certain spend level, the increase in conversions slows down and eventually plateaus. That plateau is the saturation point.
Saturation curves help visualize when ad performance plateaus, indicating fatigue. This is a real-life example from a meditation app:
- Scenario: New video ad creative showing a 30-day transformation.
- Initial results: Increasing ad spend ($1k to $5k daily) significantly increases daily trial sign-ups (each $1k ≈ 100 extra trials).
- Saturation point: The trial increase slows significantly beyond $5k daily spend. At $8k, an extra $1k yields only ~20 trials. At $10k, almost no new trials are gained.
- Curve behavior: The spend vs. trial sign-up curve flattens, indicating saturation. Further spending is inefficient.
- CTR/Conversion rate: Plotting CTR or conversion rate over cumulative impressions will likely decline as the audience sees the ad repeatedly.
- Key takeaway: The plateau or decline in the saturation curve signals ad fatigue.
Key takeaways on how to implement the best practices:
- Use visualization tools to plot metrics.
- Identify the inflection point (fatigue point).
- Use this as a guideline for future campaigns and creative refresh cycles.
- Compare curves between creatives to understand their longevity.
iOS analysis
In a post-IDFA era, where multiple limitations push mobile app advertisers to think outside the box, having an effective strategy to measure the impact of iOS efforts is essential to achieve profitable growth. For this to happen, getting as close as possible to a reliable source of truth that reports stable and valid data is vital to making better decisions.
These are three different paths advertisers can follow to predict ad performance impact on a business (hint: leveraging all of them at the same time is what will set you apart).
SKAN capabilities
This article won’t cover all the pros and cons of SKAdNetwork’s framework, but instead will focus on maximizing its current features to obtain reliable and deterministic insights into understanding when an ad is becoming fatigued and delivering poor performance.
Key concepts:
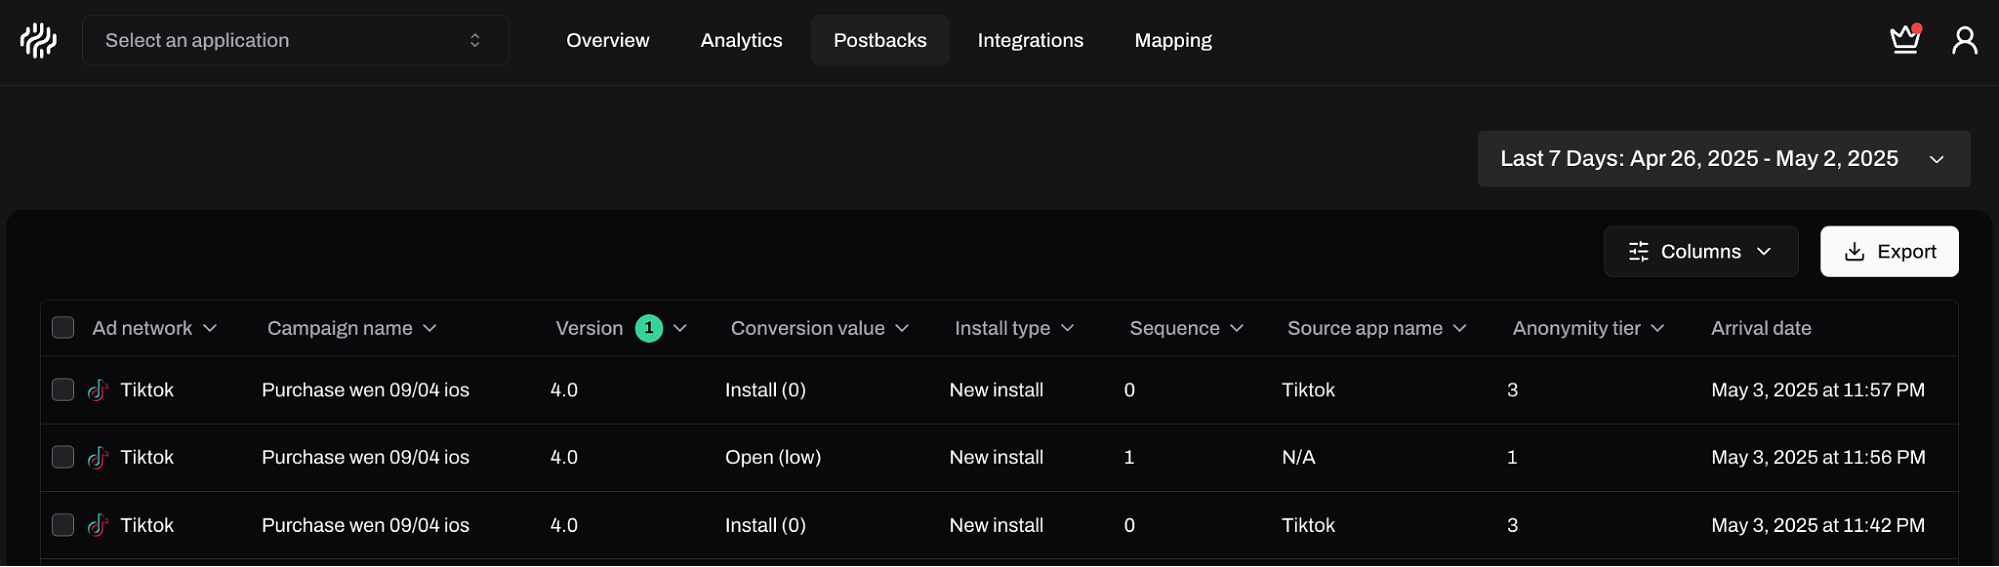
- SKAdNetwork will only provide deterministic insights at the campaign level, and then the ad networks are responsible for modeling the data to the ad level (measurement tools like Appstack provide independent data enrichment to avoid relying on the ad networks).
- Adding revenue ranges to the conversion value mapping is the only way for advertisers to get estimated revenue from the marketing efforts.
- Null values greatly limit the amount of context we have regarding performance from a specific campaign. So, it’s essential to have product insights like ARPU to build advanced estimations. More on how to do this: https://www.revenuecat.com/blog/growth/skadnetwork-guide-subscription-apps/#h-working-with-no-user-level-data
- Depending on the postback version, more or less data will be collected. So, push for 4.0 postbacks as much as possible to reduce dependency on modeled efforts.
The big question is: How can I predict ad fatigue on iOS that negatively impacts my business?
These are the things you must be doing to be able to answer the question:
- Add revenue ranges to key conversion values that generate revenue, and have a simple mapping to reduce the noise and increase the number of postbacks with revenue attached. For example, avoid adding revenue to events like paywall_viewed and setting an order of priority where the most frequent in-app event that brings in the most revenue gets overridden by less relevant events.
- Instead of focusing on the number of null values, the main KPI is the total number of postbacks (conversions) that Apple is passing back to you and the ad networks. Although a null postback lacks the context of what the users did, it still shows an attributed in-app event by a user.
- If you are running on SKAN 4.0, a great way to detect ad fatigue is to monitor whether the anonymity tier is decreasing while the ad spend remains stable. This means that due to a decrease in downloads, Apple is starting to limit the data you get back because fewer users are converting (the image below explains easily how you can identify the anonymity tier using Appstack).
Blended approach
Thus far, we’ve discussed specific channels and signals. Another high-level methodology is to build a blended metric that combines various data sources, such as app store analytics and ad data, to gauge the impact of ad fatigue on your business.
To make this possible, you must fetch the data from App Store Connect and Google Play Console. But using RevenueCat could help you avoid unnecessary pain since these APIs are complex to handle.
These are some real-life examples you can apply:
- Looking at Day 0 revenue from new users (excluding subscription renewals). For subscription apps, Day 0 revenue might include first subscription payments (if you offer no free trial) or one-time starter pack purchases, etc., but excludes money from existing subscribers renewing. When the metric dips, it’s a warning that your ads (collectively) are losing effectiveness.
- Take the total new subscriptions (or trial starts) in a period and divide by the total paid ad impressions served. This is a cross-channel efficiency metric. If, over time, each 1,000 ad impressions yields fewer and fewer subscribers, despite similar targeting, it likely means the creatives are less compelling (due to fatigue or creative burnout). The metric naturally blends all channels and creatives into one rate.
- Blended ROAS on initial purchase (say an annual sub upfront), measures the return on ad spend within the first 24 hours of install. If, historically, your blended Day0 ROAS was 20% (i.e., you earned back 20% of the spending on Day0 from new users) and now it’s 10%, something has degraded. It could be targeting, but if targeting is constant, it is likely due to creative fatigue, leading to lower intent installs.
It’s essential to remember that any blended proxy use for decision making has a potential deviation, resulting in inaccurate decisions. Although the data is accurate at a high level, granular actions lack the necessary evidence to justify a potential uplift.
Available proxies
In the era of user privacy (post-IDFA, SKAN, etc.), it’s become harder to get granular ad data, especially on iOS. However, savvy marketers can leverage the two main available proxies to approximate creative performance decline.
These proxies are:
1. Custom Product Pages (CPPs)
Apple’s App Store allows developers to create multiple versions of the product page (each with different screenshots, app preview videos, and copy) and tie them to different campaigns via unique URLs. Many subscription apps use CPPs to align the App Store listing with the ad creative.
- Create specific App Store product page versions (CPPs) that match your ad creatives (e.g., a “Yoga” for yoga-focused ads). Since you will have multiple creatives deployed simultaneously, a pro tip is to simplify the CPP structure by using angles that resonate with the ads you want to test.
- App Store Connect CPP’s tracks metrics like impressions, installs, and proceeds.
- A decline in multiple metrics on a specific CPP suggests the linked ad creative is becoming less effective.
- For example, a finance app sees a drop in conversion on its “Budgeting” CPP, mirroring a CTR decline on the associated ads, indicating ad fatigue for that theme.
- Without CPPs, you’d only see overall campaign data in SKAN and might miss creative-specific fatigue.
2. App Store Connect (ASC)
Use App Store Connect to identify how many users are landing on your product page by looking at the app referrer. To see this, you must go to analytics inside your ASC account, select the metric you want to analyze, and then filter by app referrer.
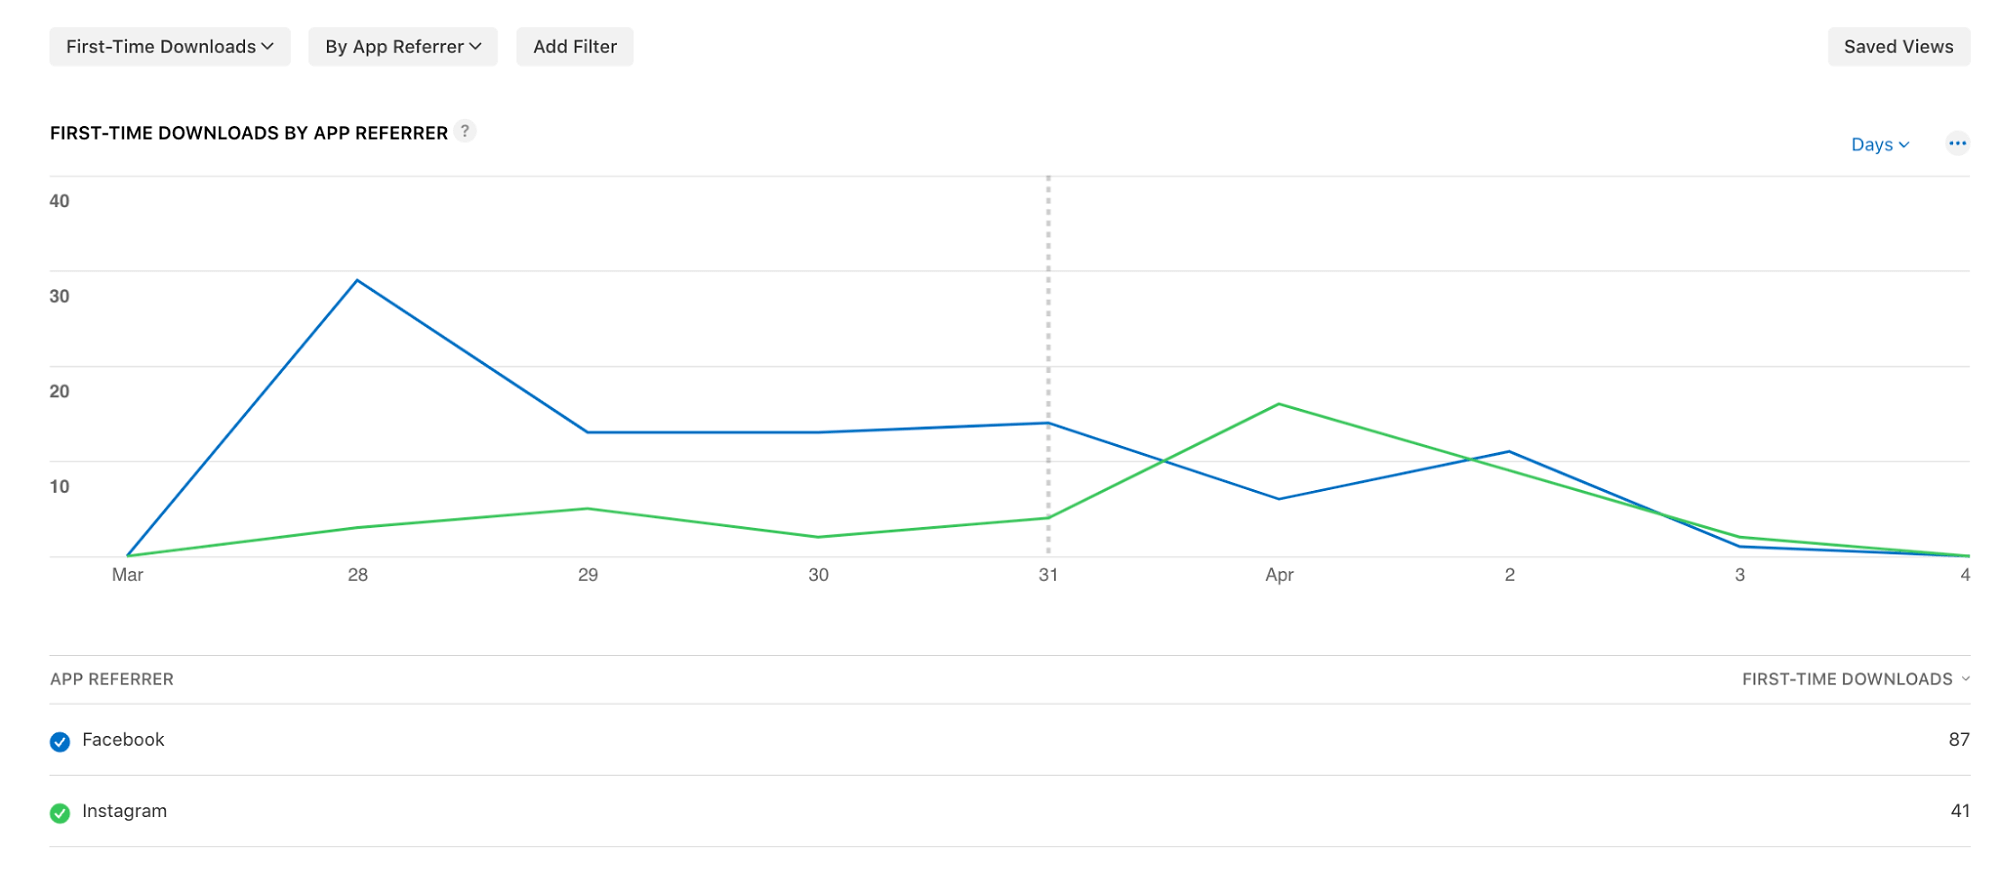
For example, you can use the impressions metric to signal how many users are landing on the app store for multiple ad networks like TikTok, Instagram or Facebook. You can also examine deeper metrics, such as revenue or sales, to determine if ad fatigue is affecting the quality of users.
Additionally, applying this filter will provide you with visibility into unique insights if you simultaneously show ads on hundreds of apps. For example, a lifestyle app I worked with realized that one of the most profitable ads run on Google Ads was not showing on Google itself or YouTube but instead on a music app. Thanks to this information, the lifestyle app reached out to the music app for a partnership to drive more users to their product due to high synergy and interest of their user base.
Key takeaways:
- Combine multiple proxy signals (e.g., Custom Product Page metrics and app-referrer install counts) to gauge creative health.
- A simultaneous drop across two independent proxies strengthens the case for ad fatigue.
- Treat this dual confirmation as a trigger to refresh creatives or rebalance spend.
- Act even if the ad network dashboard hasn’t flagged the issue yet—proxies surface problems sooner.
Conclusion
Ad fatigue in 2025 is a multifaceted challenge, particularly for mobile subscription apps that rely on continuous user acquisition. The traditional telltales – declining CTR and rising frequency – are still relevant, but as we’ve explored, they are only part of the picture.
Ad creative fatigue checklist
Baseline pulse
- Capture today’s CTR, CVR, CPI, ROAS & Revenue for every live creative.
- Record average frequency per user on each channel.
- Flag any metric that drifts ±10 % week-over-week.
Cross-channel early-warning system
- Label the same creative ID across Meta, TikTok, Google, Snap, etc.
- Watch fast-cycle networks (e.g., TikTok) for the first CTR dip or CPC spike.
- Build a simple “fatigue map” → log how many days later other channels follow.
- Refresh the creative the moment two channels flash the same downtrend.
Onboarding reality check
- Insert “Where did you hear about us?” in the sign-up.
- Track onboarding completion rates by ad source and correlate them with ad creative spend and activity.
- If completion drops by more than 20% for one source, queue a refresh.
Saturation-curve monitor
- Weekly, graph Spend (or Impressions) vs Conversions/Revenue.
- Mark the inflection where the marginal CPI or CPR worsens sharply.
- Set an auto-pause rule once ROI falls below your target floor.
iOS-specific SKAN guardrails
- Map revenue ranges into conversion values (keep it simple!).
- Upgrade every campaign to SKAN 4.0+; monitor anonymity tiers.
- If the anonymity tier drops while spending remains level, fatigue is the prime suspect.
Blended efficiency pulse
- Pull Day-0 revenue & new subs from App Store Connect / Play Console (or RevenueCat).
- KPI: Subs-per-1,000 paid impressions.
- KPI: Blended Day-0 ROAS; alert when it halves versus historical average.
Proxy signals
- Track Custom Product Page (CPP) installs & proceeds; falling CPP CVR ⇒ tired creative.
- In ASC, filter metrics by App Referrer to spot network-level traffic dips.
- Combine CPP drop + referrer drop for double confirmation.
Refresh and archive
- Replace any asset that triggers two or more checklist alerts.
- Archive the “fatigue map” to predict the lifespan of future creatives.
- Document learnings (angle, hook, format) for the next production cycle.