
When it comes to scaling paid ads, which metrics come to mind first? Probably something like:
- CPC – Cost per click
- CTR – Click-through rate
- CPA – Cost per install / trial / purchase
- CPM – Cost per impression
Yeah, that’s a lot of acronyms. It probably feels like reading a text chain between two Gen Zs. There are plenty of acronyms to track, and while these metrics can be useful, they won’t help you scale. You could have a low CPC and a high CTR, but if your lifetime value is too low, scaling just won’t work.
Too many performance marketers focus on platform metrics like those from Meta and Google, instead of looking beyond them. But it’s the off-platform metrics that really drive scale. So I spoke to the best of the best, the ad experts of the industry, to get their advice on the matter.
The fundamentals of scaling paid ads
At the end of the day, scaling paid ads is a balancing act. On one side, you have lifetime value (LTV): how much a customer is worth over their entire relationship with your business. On the other hand, customer acquisition cost (CAC): how much it costs to bring them in.
Together, they form your CAC-to-LTV ratio. A strong ratio means you’re earning more than it costs to acquire, which makes scaling possible. A weak one? That’s a signal to optimize before pushing budgets higher.
As you scale up your budgets on platforms like Meta, your CAC often increases. You’ve already captured the low-hanging fruit — warm audiences who’ve heard of your app or are actively looking for something similar. Now, you’re reaching colder, higher-funnel audiences. Scaling becomes a game of pushing budgets up, then trying to bring CAC back down just to keep going.
Here’s the catch: most marketers focus too heavily on reducing CAC, chasing an ideal number that’s becoming harder to hit, rather than improving the actual, realized LTV. CACs are rising year after year — and there’s only so low you can go. So instead of squeezing CAC further, flip the strategy: focus on increasing LTV.
Why? Because the ceiling on LTV is much higher and comes with additional benefits. Improving it doesn’t always come with rising costs. It also means you can grow with fewer new customers while protecting your margins.
To scale effectively, start paying closer attention to the metrics that move LTV. Improve those, and you’ll feel a whole lot more confident scaling spend and getting bigger budgets signed off.
How do you measure CAC?
For subscription apps offering trials, success with paid ads is often measured by the number of trials started on platforms like Meta, TikTok, and Google. This is because many trials don’t convert within the attribution window, especially on iOS. As a result, marketers often rely on trial starts as a proxy for performance.
But your actual CAC is your cost per subscription purchase. Ideally, you would also account for all the other costs involved in running ads, including the time spent by your team or external partners, attribution platforms, creatives, and more.
But since you aren’t doing that on the platform, it’s crucial to carefully examine your trial-to-purchase conversion rate and your actual cost per purchase.
Metrics to help you improve your LTV
Trial-to-purchase conversion rate
The trial-to-purchase conversion rate has a significant impact on the quality of sign-ups and the potential lifetime value (LTV). In my experience, a low trial-to-purchase rate often correlates with a lower LTV. However, it’s essential to layer this with downstream engagement and retention to get a full picture of user value — but more on that later.
Tools like RevenueCat allow you to send the data of which trials converted back to Meta, enabling you to double-check and calculate the trial-to-purchase conversion rate using custom metrics. Here’s the key data you’ll want to send back:
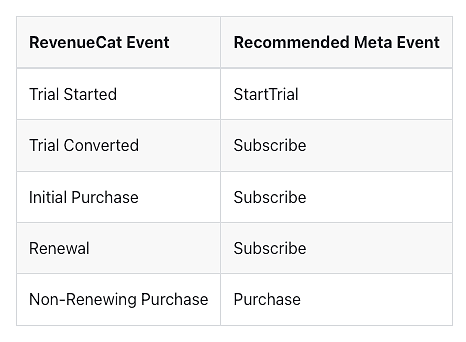
But this data is key to look at not only in Meta ads, but also on your dashboards. You want to filter and segment it to understand when you have a strong conversion rate and when you don’t.
Marcus Burke, in a Sub Club podcast interview, discusses how with a younger audience, you may see far cheaper trial sign-ups, so Meta will focus its spending on them. However, looking at the trial conversion rate, you often see that older audiences convert at a higher rate, potentially due to higher spending capacities. In those cases, he experimented with intentionally excluding younger audiences because even with the higher cost per trial, the overall cost per purchase was better. Other ways to look at this are by angle, ad, audience, and country.
Double-checking the breakdowns is crucial, and even if you use trials as your conversion event, you’re looking at the actual cost per purchase.
If you’re seeing a low trial-to-conversion rate, it’s crucial to focus on improving it to scale your business. Marcus covers 10 ways to improve this ratio, and none of them involve adding new features.
Post-trial engagement as a predictor of LTV
We know that a trial start alone isn’t a strong indicator of quality, but waiting until the trial ends can take a lot of time, especially for apps that offer longer trials. And for those not offering trials, it’s still important to gauge initial user quality early on.
This is where engagement metrics come in handy. They offer an indication that new customers are likely to stick around and some form of activation within the first week or so. It could be the use of a key feature or a certain number of sessions within the first week. Just like with trial-to-conversion, understanding who sticks around and who doesn’t is hugely insightful.
However, as Hannah Parvaz, founder of Aperture (an app growth agency), highlights how this only works if your engagement metric occurs within the first 7 days:
“At a previous company, we identified that users became much less likely to churn after completing six core actions across six different days. In this case, a core action was finishing a story. That was our activation point. Not just signing up or trying it once, but reaching the sixth meaningful interaction.Since this point typically occurred after 7 days, we did not optimize for it on Meta or any other platform. Especially because at the time, we were in the pink mist of iOS 14.5, when attribution windows had shortened.”
Should you then use trials instead? You can, but if you’re seeing it’s driving low-quality subscribers you could instead send alternative engagement/activation signals back instead.
I asked Hannah about this given she’s running Meta ads for a multitude of subscription apps. She shared the following:
“The optimization point you choose depends on the product. For some companies, we stick to trials. For others, we define an “activated trial” and fire a separate event a few hours after the trial is taken out, if the trial has not been cancelled yet. (You can check the billing status to do this.) For others, if the budget allows for it, we’ll do a trial + core action custom event and map this. This will be more expensive to achieve and requires a larger investment, but can pay off in the long term.”
I’ve also seen this activated trial work well as a goal, it reduces the focus on subscribers who sign up for a trial only to cancel immediately, and instead pushes Meta to focus on subscribers who are more likely to stick around.
As a result, it can help improve targeting and ensures you’re acquiring high-quality subscribers.
Note, whilst we are talking a lot about trials here, I am conscious that not all subscription apps offer a free trial. For those that don’t, they may prefer to stick to purchases as a conversion goal instead of an engagement metric because the volume will usually be lower than trials started and an engagement goal may reduce it further making it hard to feed the ad platform algorithm enough data on which ads are performing and which ones aren’t.
That is not to say you shouldn’t still be monitoring an engagement metrics as a performance marketer, rather that if you want to test it as a conversion goal, you may only do so once you’ve initial scaled spend. In which case it can be worth testing, especially if you’re struggling with lower LTVs holding you back from scaling up further.
Which brings us on to one of my favourite metrics.
Realized LTV per paying customer / average revenue per paying User (ARPPU)
We’ve talked about overall LTV, but even after years, it’s still often treated as hypothetical — what people might spend over time.
If you think of Meta as a growth loop, the loop goes like this:
- You run ads
- You acquire new subscribers
- That generates revenue
- You then reinvest that revenue to run more ads
Sounds simple and great in theory. The issue? Setting attribution aside (that’s a whole other can of worms we won’t open here), potential revenue can’t be reinvested. So, instead, you want to look at what has actually been generated to date.
The way you do this is by focusing on Realized LTV per Paying Customer / Average Revenue Per Paying User (ARPPU). RevenueCat defines it as follows:
“Realized LTV (Lifetime Value) per Paying Customer (sometimes also called Average Revenue per Paying User, ARPPU) shows the actual revenue (minus refunds) that was generated by a cohort of paying customers, divided by the number of customers in that cohort.”
You also want to be understanding which campaigns and ads are driving a higher ARPPU in order to make your ads more profitable and improve the ratio of ARPPU / CAC.
When I interviewed Cedric Yarish, co-founder of admanage.ai, on different ways to experiment on Meta, he shared how, during his time leading user acquisition at Photoroom, they used onboarding data to distinguish between business users and individual creators. They then associated a higher value with business users and sent that information back to Meta because they saw the realized LTV was much higher for business users. This helped them ensure they were focusing their campaigns on the most profitable customers, allowing them to scale up their ad budgets faster.
Now knowing your realized LTV per paying customer from Meta helps you work out another key metric that will help you speed up that ad growth loop: your payback period. How long does it take to cover the costs of acquisition?
Payback period
This is a key determinant in how quickly your growth loop can progress. A shorter payback period, assuming you’re confident in attributing those sales to Meta, will allow you to scale up your ads more quickly.
However, it is a tricky one to calculate correctly, as Nathan Hudson, founder of Perceptycs, shares:
“With multiple pricing plans and plan durations, different percentages of users purchasing each of these in any given cohort, fluctuating trial conversion rates, and unknown renewal rates influenced by seasonality, it’s very challenging to accurately forecast payback period.
For this reason, I’m a big advocate of tracking blended ARPPU:CAC ratio off platform at various periods – day 0, day 3, day 7, day 30, day 90, day 365. If we set a target payback period and have enough historical data, we can track a forward-assumed ARPPU:CAC ratio for any given cohort at any given period.
Of course, these are just predictions, but they give another view of performance that can be used to scale up or pull back Meta’s acquisition.”
So again, he is looking at actual spend in the past to help predict the potential profitability of future subscribers and how long it will take to earn back the costs.
As mentioned earlier, make sure to consider your CAC, including all associated costs for the month: time spent by your team or external partners, attribution platforms, creatives, and more. The way I do this is by doing a double check per month of the total costs vs acquired users, as some of these costs will be fixed.
Now, longer payback periods mean higher risk because if the ARPPU is lower than you predicted, you risk acquiring unprofitable users. So, if the payback period is too long, you can use the realized LTV per paying customer/ARPPU to help you identify and prioritize users who naturally spend more.
In short, this metric not only shapes your growth pacing but also helps inform which data to send back to your ad platform, so you can attract more of the customers that truly matter.
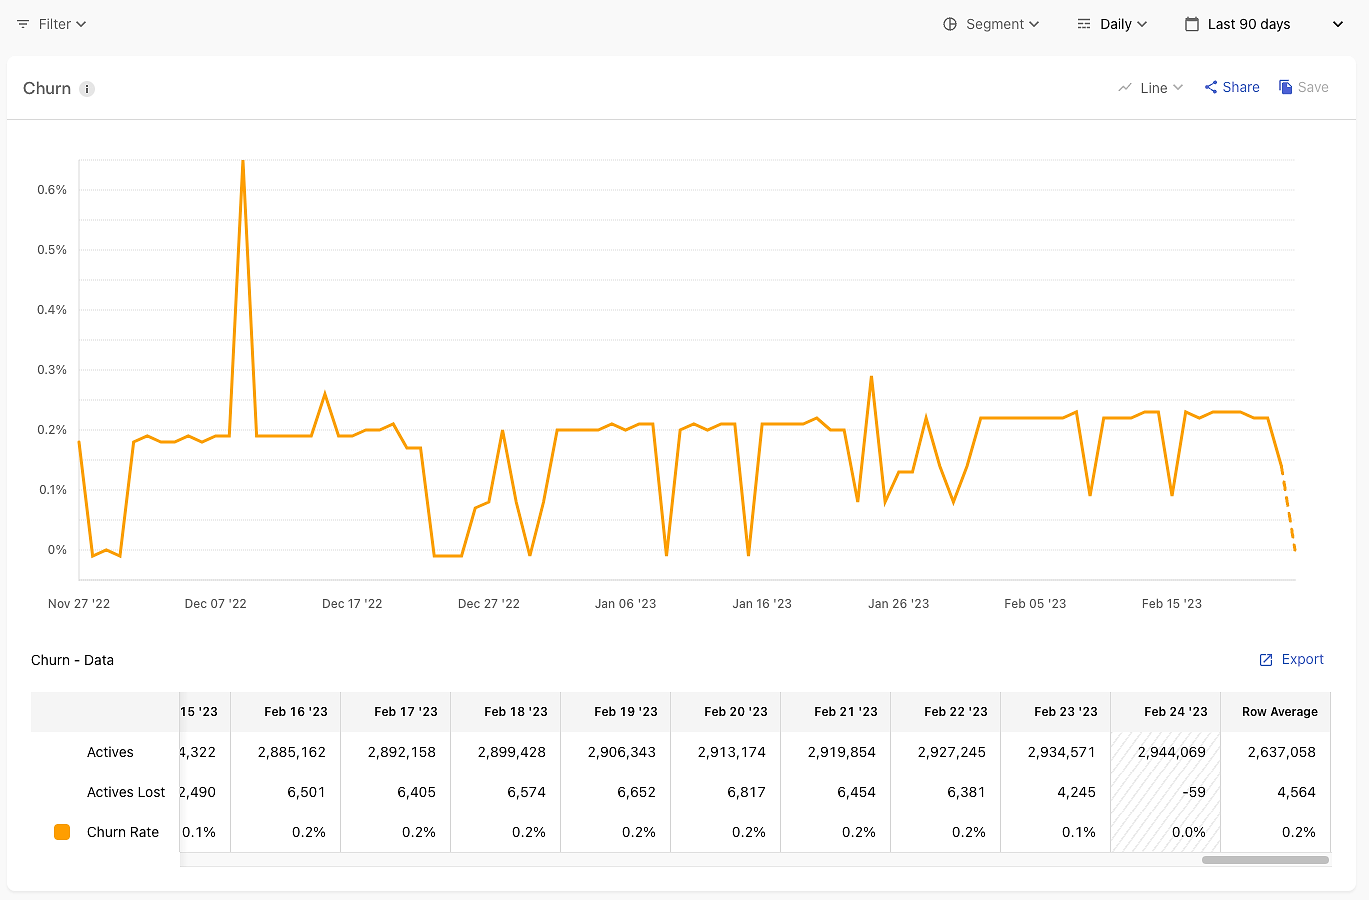
Churn rate & renewals
The churn rate measures the number of subscriptions lost over a given period. When it comes to paid ads, comparing the churn rate of platform-acquired users to your overall churn rate helps you spot whether retention issues are limiting your ability to scale.
In my experience, paid users tend to churn at a higher rate than those from organic sources. That said, if the gap is too large, it’s a red flag — and we all know that red flags should never be ignored, whether that’s on a first date or paid ads. It could mean you’re attracting the wrong audience or setting unrealistic expectations early in the user journey.
If your overall churn rate is low, it could be a sign that you need to focus on activation and retention before trying to scale on Meta. Cedric Yarish explains why more marketers don’t prioritize this metric:
“Generally, performance marketers only focus on metrics they can change, and churn is usually outside the scope. But it’s important because it affects your LTV and thus affects your bid in Meta.”
Just because something is out of your direct control doesn’t mean you shouldn’t push to improve it, especially if it’s limiting your ability to scale budgets.
With annual subscriptions, churn can be a lagging metric, so you should already be tracking engagement early on. That said, looking at monthly renewal rates can offer quicker insight into audience and campaign quality.
New trialists/subscriptions
If you’re just reacquiring the same subscribers over and over, your CAC/LTV ratio might look great on paper, but in reality, it’s not. It ends up being inefficient, since you’re often spending the same amount to reacquire an existing user as you would to bring in someone new. Not ideal. This would be the equivalent of dating the same person over and over, hoping it will end differently — maybe this time!
So, how do you use this in practice? If you’re using Meta primarily as an acquisition channel, as most brands are, tracking the cost per new trial or subscriber is essential.
Even when you connect your subscriber data with Meta, the system isn’t flawless. In my experience, a proportion of the budget almost always ends up targeting existing users. That’s why it’s important to figure out which ads are actually driving new subscribers; it’s the only way to make sure scaling your ad spend results in real revenue growth.
Aazar Shad, who’s helped scale education brands from $1 million to $10 million using Meta Ads, shared that he spent far more time focusing on this dashboard that pulls data directly from the app, as well as looking purely at Meta to see what is happening in terms of new users:
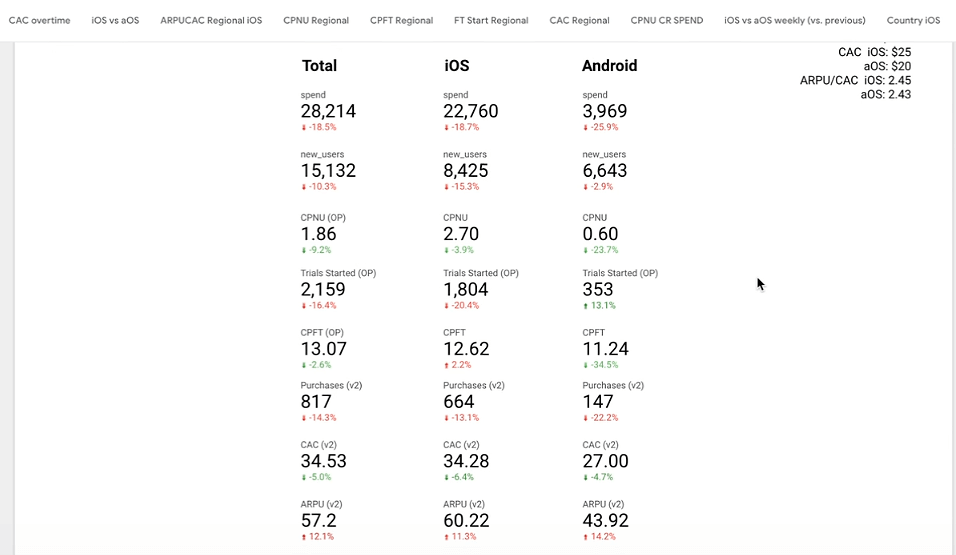
One of his favourite metrics is looking at cost per new user:
“I have a dashboard where we connect the Meta data with the app to look at Cost per New User (CPNU) as well as Average Revenue Per Paying User / CAC. I really like looking at CPNU per ad and obsess about it because if the CPNU is down, it’s a good indicator that the ad is working. When this goes higher, I see the cost of purchase increase too, so it’s an early indicator.”
Just keep in mind: while CPNU (cost per new user) is a great directional metric, it should always be sanity-checked against incrementality and the quality of your attribution. With new subscribers, incremental testing, and an increase in your budget, and seeing the difference in overall revenue can also provide valuable insights.
If you’re noticing that the share of new users is too low, there’s another approach worth considering. Cedric Yarish pointed out in our interview that too many brands still rely heavily on view-through attribution. Instead, he recommends shifting to 1-day or 7-day click attribution, which he believes offers much more accurate and actionable insights.
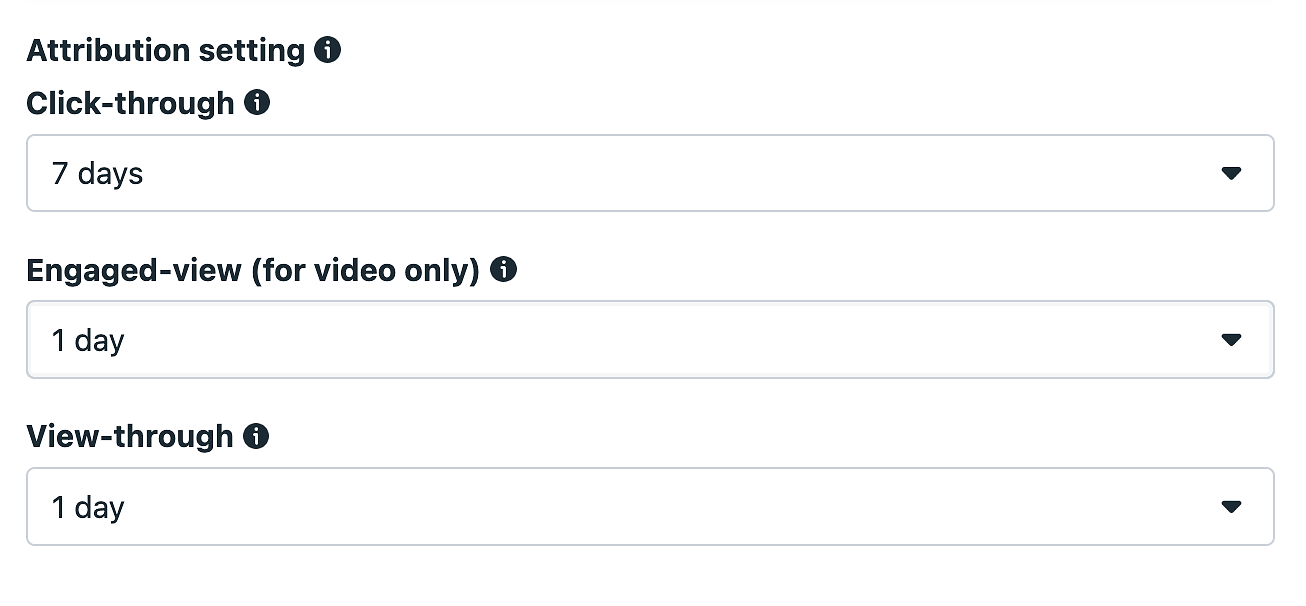
With ads, you really have to be conscious of whether they’re truly incremental and actually driving results. Broad ad channels can lead to a lot of wasted spend, so the more control you have here, the better. Cedric typically uses 1-day click attribution, but if the consideration period is longer, he switches to 7-day click attribution.
That’s why tracking the total number of new subscribers is so essential.
Scaling your performance ads
Scaling paid ads isn’t about chasing cheap clicks; it’s about optimizing for real, lasting value. That means zooming out beyond the ad platforms and focusing on the metrics that truly drive growth: trial-to-subscription conversion, engagement, realized LTV/ARPPU, churn/renewal, and cost per new subscriber.
Which of these matter the most will change as you grow, Hannah Parvaz summarizes this perfectly:
“At a smaller scale, cost per trial (CPT) is one of the most important metrics. It gives you a fast signal on whether your top-of-funnel economics are working. But CPT alone is not enough.
You must also track trial-to-paid conversion rate and your payback window. As you scale, you should start obsessing less about CPMs or CTRs and more on downstream unit economics. CPMs can fluctuate. CTRs can look great without any revenue behind them. The deeper metrics tell you if your growth is sustainable.
At a very large scale, retention and contribution margin per cohort start to matter even more. But you need to earn the right to worry about that. Early on, cost per trial, trial-to-paid, and payback are your critical path.”
Most performance marketers optimize for the top of the funnel rather than for profitability. But to scale effectively, you need to send better data back into your ad platforms, ensure retention is strong enough to support growth, and track the metrics that reflect actual business impact, not just ad performance.
That’s how you scale faster and more sustainably than any low CPC ever could.