


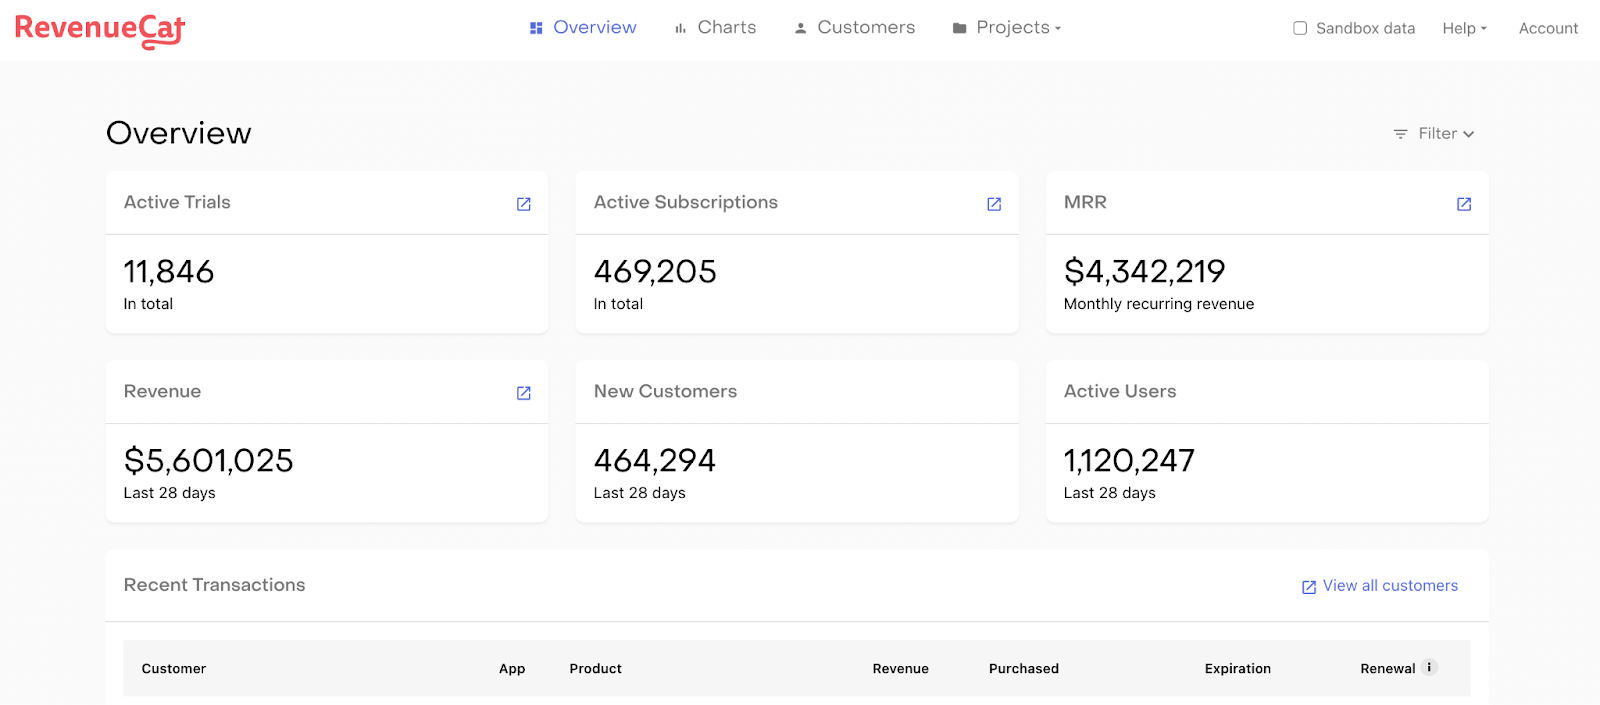
Your mobile subscription analytics dashboard can give you a quick pulse-check for your mobile app business and help your team stay dialed in to key performance metrics. Since not everyone will have time for a daily data deep-dive (try saying that five times fast!), your dashboard is a great way to keep everyone on the same page. Any changes in your top-line numbers could indicate a problem, and you need to dig into more detailed analytics to uncover what’s behind those dips and bumps.
Here are the topline mobile subscription metrics that we keep on our dashboard at RevenueCat, and some of the deeper metrics we use to diagnose the causes behind any volatility.
Active Trials
With mobile subscription analytics, the number of active trials is a good leading indicator of growth. All things equal, if trials are converted to paid subscriptions at an increased pace, your active subscriptions and ultimately monthly recurring revenue (MRR) will grow. On the other hand, if the number of active trials is trending down, that could mean your overall business is decelerating. Your marketing and growth teams will be particularly interested in how this number is trending to understand if campaigns are reaching the right people.
Want to go a layer deeper?
Look under the hood of Active Trials to see what’s driving growth or decline with these metrics.
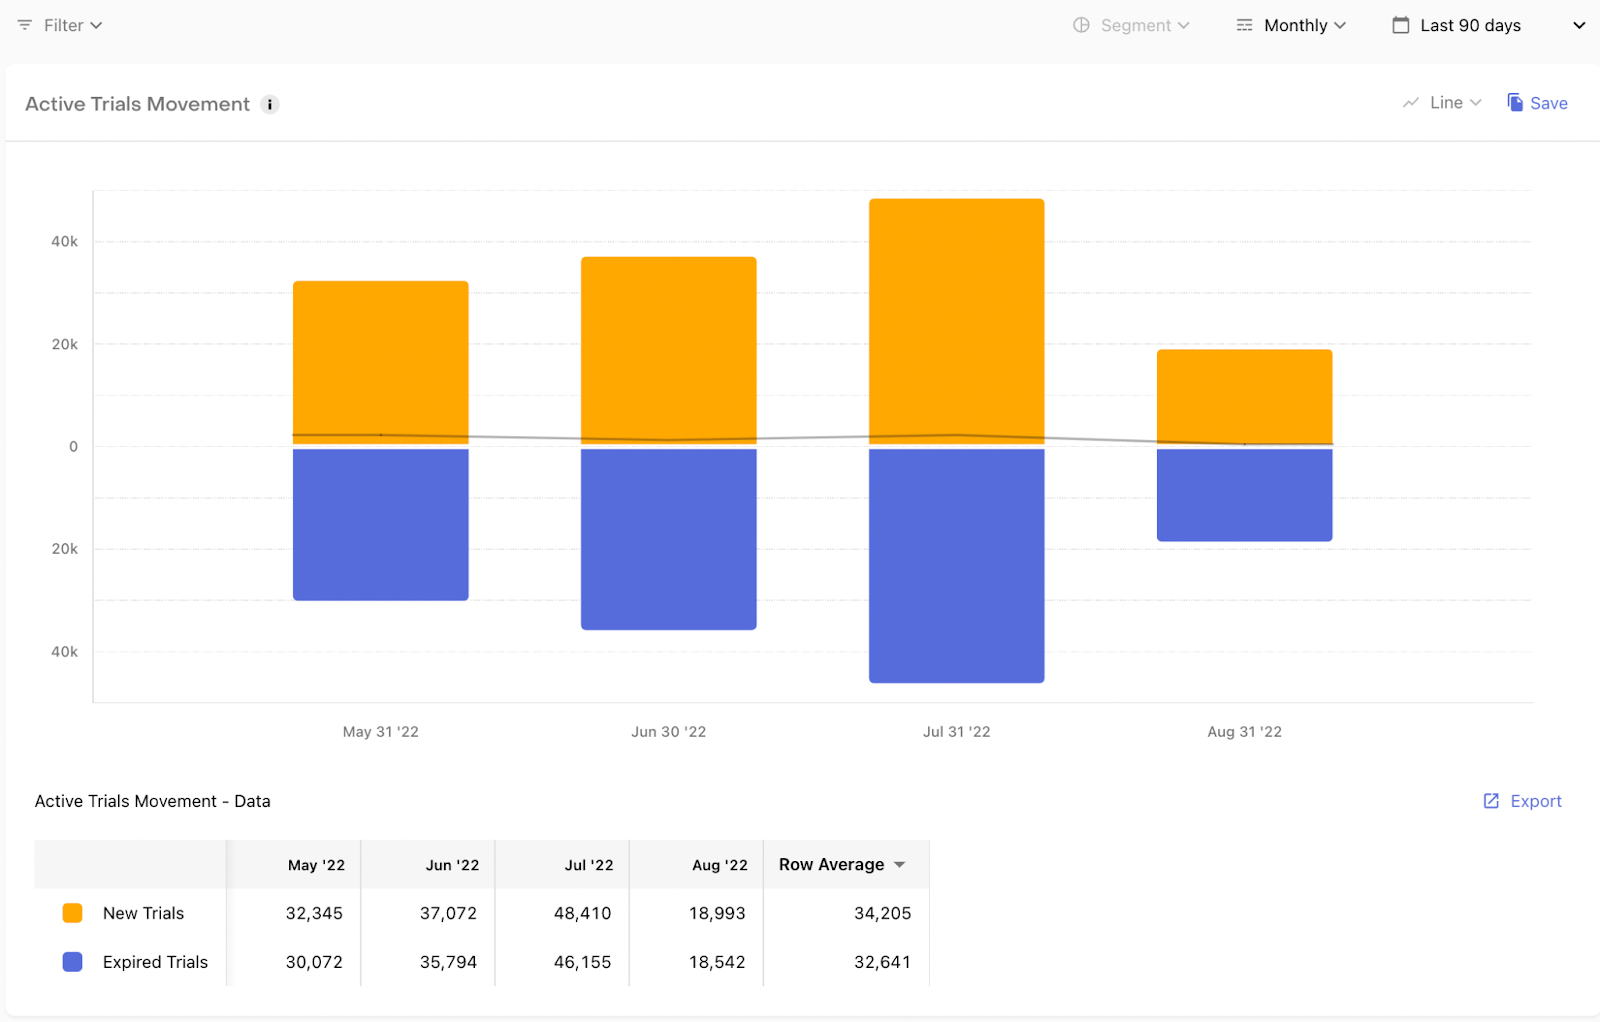
Active Trial Movement
This metric gives you an idea of how your active trial base is evolving. Here’s how it’s calculated:
New Trials - Expired Trials = Active Trial Movement
Monitoring changes in new trials relative to expired trials in a given period can help you better understand your trial base. New trials are trials started during a given period, while expired trials are the trials that completed during that time frame. The difference between these two numbers is your active trial movement, and it tells you if your trial base is growing or shrinking.
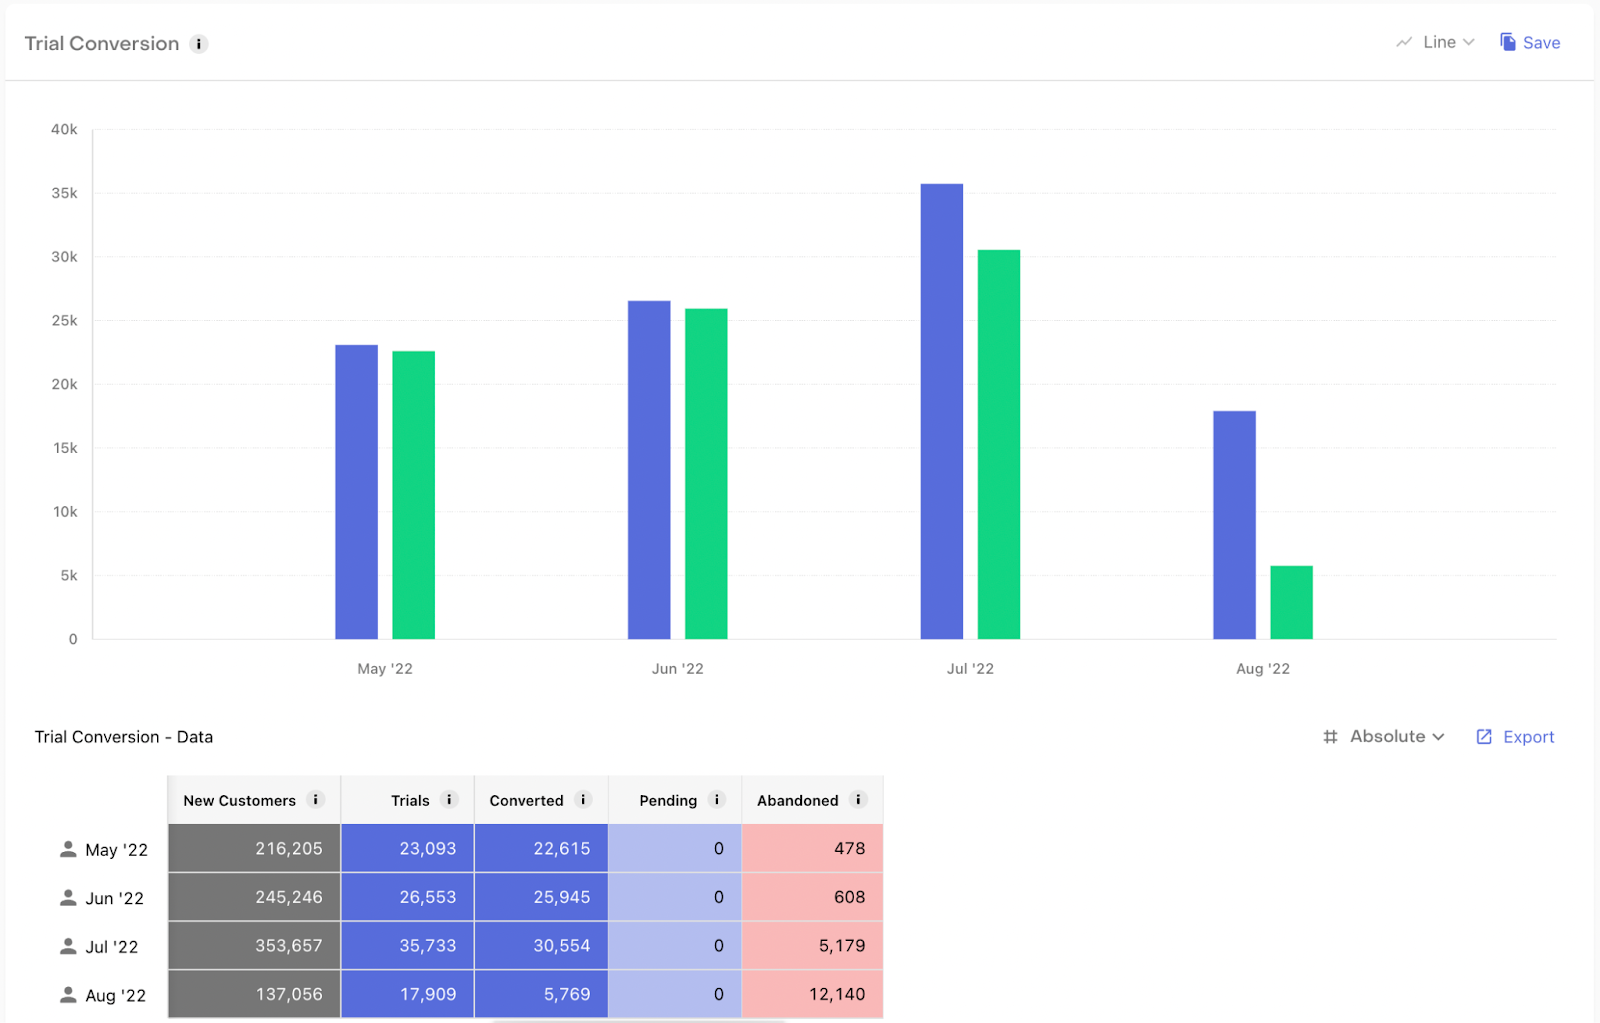
Trial Conversion
But what about how well those free trials are working? The Trial Conversion metric tells you how often free trials convert to paid subscriptions. It’s helpful to plot trial conversions by cohort to see how this metric changes based on the date a customer was first seen.
Customers in trial cohort who become paid subscribers / # of Customers in trial cohort = Trial Conversion
Your trial conversion funnel is extremely important for understanding how well your app is monetizing and can indicate the overall fit of your product and pricing.
Active Users
This metric can give you a sense of how many total users (free and paid) are actively using your app. Whether this number is trending up or down, your product, marketing and management teams will want to know so they can patch any leaks or further accelerate growth.
Active Subscriptions
Active Subscriptions shows the number of current paid subscriptions. This metric is useful for understanding the number of individual, recurring relationships you are currently serving and is a proxy for the size of your business. This is especially powerful when combined with filters and segments to understand what’s driving those subscriptions.
Revenue
Need we say more? Having millions of downloads and users is great, but that alone won’t pay your bills. You need to know how much money is coming in through subscription revenue and whether that amount is trending up or down.
Monthly Recurring Revenue
Monthly Recurring Revenue (MRR)
Monthly Recurring Revenue, or MRR, is a way of normalizing the scale of your business to better understand your size or velocity. It doesn’t map directly to revenue, but it’s a useful standardization.
Your MRR is calculated by “normalizing” each subscription to a 1-month period, then adding all of those amounts together:
(Total paid for the full duration period active subscription / number of months in subscription period)(Total number of subscriptions) = Monthly Recurring Revenue
For example, a subscription that costs $8 per month will contribute $8 to MRR while it’s active. An annual subscription that costs $120 per year will contribute $10 dollars per month to MRR for 12 months. Normalizing all of your subscriptions to a 1-month period makes it easier to compare monthly and annual subscriptions.
Non-recurring subscriptions and consumable or one-time purchases are not included in your MRR. MRR is an important metric because it captures the size of your subscriber base and translates that into a real measure of the velocity of your business.
Want to dig deeper into recurring revenue?
Looking at how recurring revenue evolves over time can help you uncover meaningful insights.
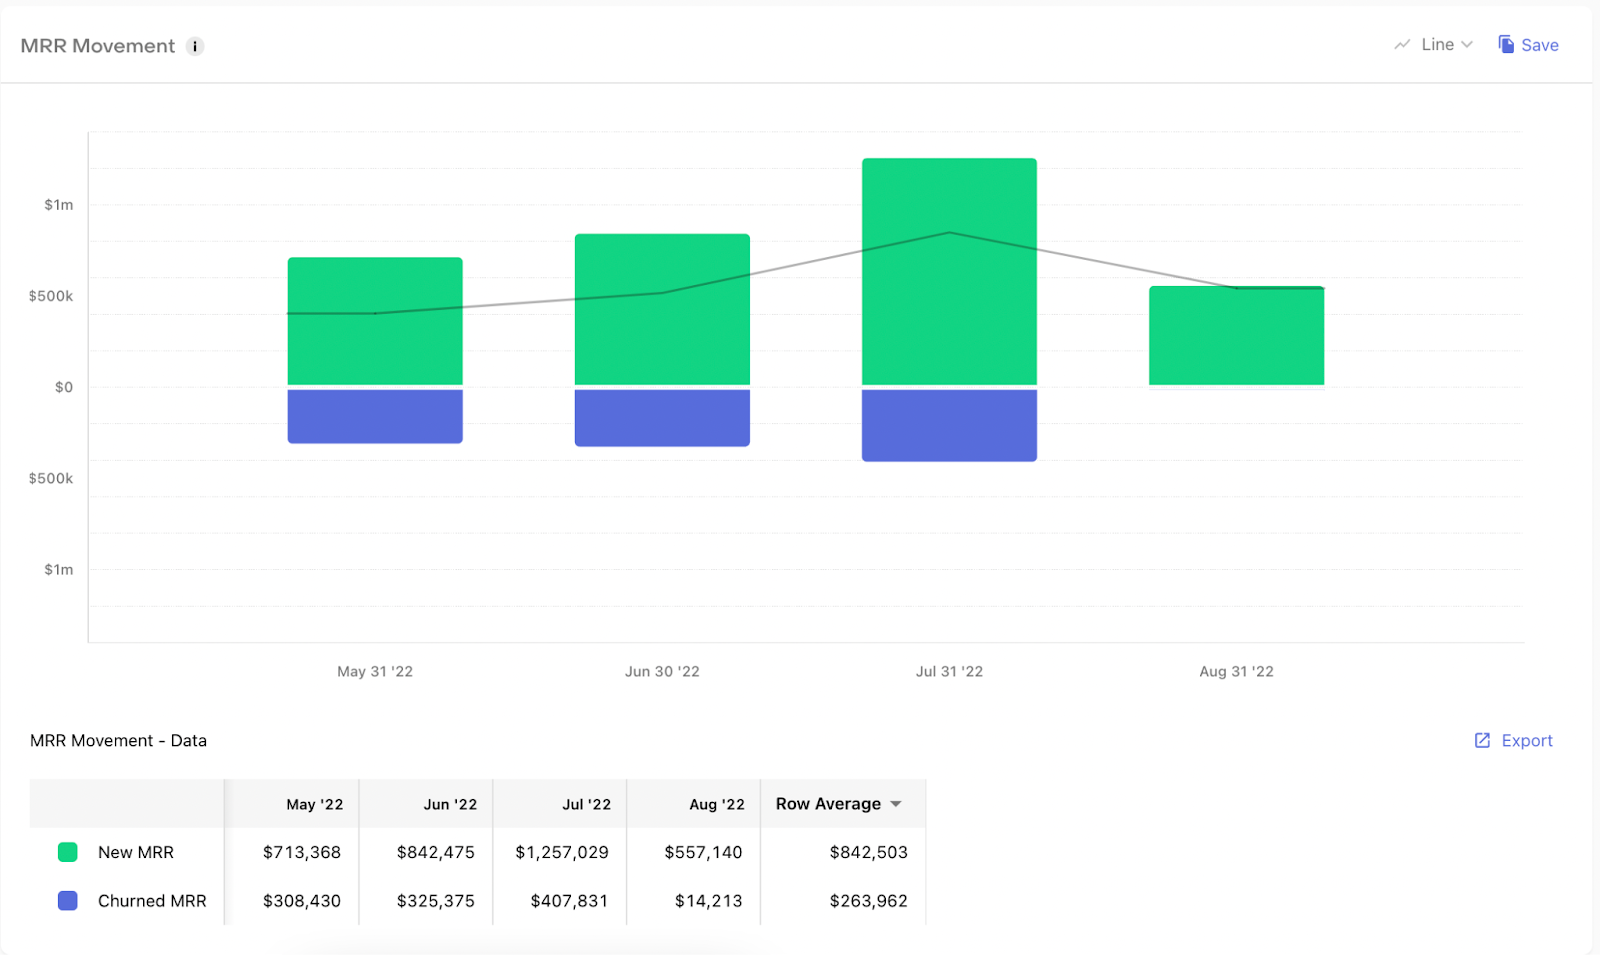
Monthly Recurring Revenue Movement
Monthly Recurring Revenue Movement shows how new subscriptions and churned subscriptions affect your MRR.
New MRR is MRR that was added during a given period from new subscriptions. Churned MRR is MRR that was lost in a given period from churned subscriptions.
Understanding your MRR movement can help you determine what factors cause your MRR, and your overall business, to grow or shrink.
New Customers
One way to grow your app’s revenue is to bring in new customers. Are you adding new customers at a consistent rate? Or is that number growing or falling? When monitoring mobile subscription analytics, keep an eye on the New Customers metric to get a pulse-check on your marketing funnel.
Want to drill deeper on your new customers?
It feels great to see that New Customers number go up, but are you bringing in the right kind of customer to profitably grow your business?
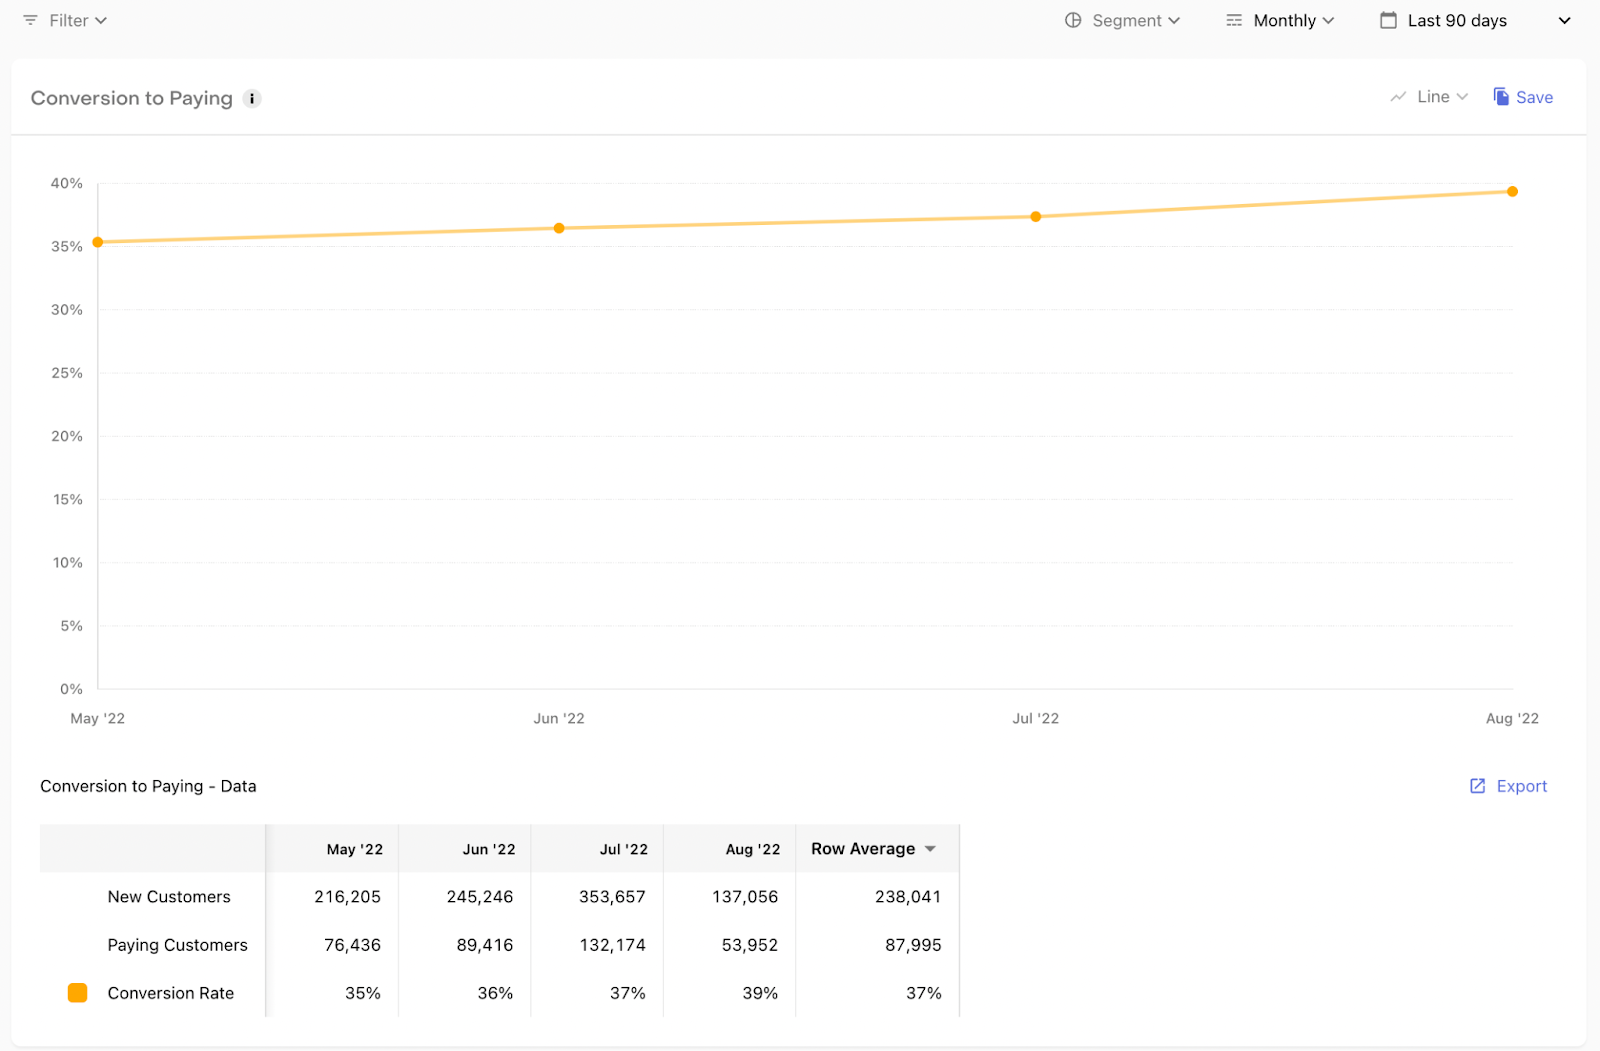
Conversion to Paying
The Conversion to Paying metric shows what proportion of new customers (including free trial users) end up becoming paying users.
New Customers on Paid Plans / Total New Customers = Conversion to Paying
This metric is a good indicator of how effective your app is at acquiring the right kind of customers and demonstrating the value of your premium products.
Does your team have centralized access to reliable mobile subscription analytics?
There’s no shortage of valuable mobile subscription analytics to monitor, but your metrics and insights are only as good as the data they’re based on. Cross-platform subscription analytics can be an implementation and reliability nightmare. What’s more, if that data isn’t actionable and centrally available, your data team may end up bogged down with dozens of ad-hoc requests.
RevenueCat Charts empowers your mobile app team with centralized access to clean, cross-platform data visualizations for 15+ subscription app metrics that can help you drive your business towards success. Charts is unlike other data visualization tools because the data are synced directly with RevenueCat’s in-app payments infrastructure — giving you real-time customer and subscription information across Apple, Google, and the web.