
Statsig is a modern experimentation platform that provides insight into what your users think of new features, so you can make informed product decisions and deploy with confidence. It automatically runs A/B tests on new features as they’re rolled out and measures their impact on key business metrics, such as user growth and revenue.
Integrating RevenueCat with Statsig is easy — you can forward user lifecycle events like trial starts and cancellations to run tests and optimize your revenue and growth.
3 Experiments to Run Today
With Statsig, you can run A/B tests in your apps and understand the results of your experiments on an ecosystem level. One common pitfall of running experiments is optimizing for a single metric, without seeing how other metrics are affected.
Here are three experiments you can run to optimize your app. Keep in mind: all apps are not created equal, and an optimization for one could cause regressions in another. By integrating RevenueCat with Statsig, you’ll be able to understand if the results of your experiments have a positive effect on the metrics you care about.
Simplify Your Signup Flow
Optimizing the top of your app’s funnel can have huge down-stream effects. The number of users trying out your app or website for the first time can be enormous, and optimizing your conversion rate by just a few percentage points can add up to a big increase in active users. One way to increase your conversion rate is by simplifying your signup flow.
The more questions you ask, the more users will drop off instead of completing the sign-up flow. Soo an easy optimization is to reduce the number of required fields. For example, if right now you’re requiring users to fill in both their first name and last name, consider requiring only one — or try asking only for their email address and letting them fill out the rest of their info later.
It’s worth noting that this might not be beneficial for every app. If personalization is a core part of your product, simplifying the initial sign-up experience could have a negative effect on your engagement or retention metrics.
Reduce the Number of Options
Especially when users are first starting out with your app, too many options can be overwhelming. In general, the more complicated it is for a user to take an action is, the fewer users will actually do it.
For example, when a user is starting a new game, they might need to choose a difficulty level, set up their character, and so on. If they don’t understand what each of these options really means for the game, it’s easy for them to feel stuck or confused. This is why most game developers include a tutorial, guiding users down a single path before opening up more options later.
Another example is creating VMs on cloud providers. Someone that has never had to deal with configurations before could easily be overwhelmed by having to choose between a medium or large node, Memory or Compute-optimized, what type of storage they need.
Having one or only a few options to choose from can smooth out the experience for new users. However, this could also backfire in a few ways: Users could become frustrated if the options you present are too simple for the amount of context or knowledge they have at that time. If a tutorial is too long, a user might quit because they get bored. If the options to configure your VM are too simple, an advanced user might choose a different platform that gives them more freedom.
Test Variations of In-App Purchases
If your app offers in-app purchases, there are many experiments you can run to encourage in-app purchase monetization by tinkering with pricing, discounts, and presentation.
When you’re deciding how to price or discount an item, you can run a price testing experiment to show different values to different users. This kind of experiment has clear, immediate results. A higher price might cause fewer users to purchase the item, but if the decrease in purchases is small enough, your overall revenue might be higher. On the other hand, lowering the price might increase the total number of purchases, but if some of those users would have purchased the product anyway, your overall revenue might drop.
There’s also the longer-term effect of how purchasing these items can affect a user’s behavior. Potentially a short-term decrease in revenue by having more users purchase items can lead to an increase in retention, and an increase in longer-term purchases. With Statsig, you can measure all of these to identify which variations perform the best in the long term.
You can also run experiments suggesting different price tiers that users can purchase. For example, you could present Small, Medium, and Large variations of a given item, where the Small and Large items are a good deal, but the Medium item gives you an opportunity to upsell to Large for a better value.
Configuration
On Statsig:
- Create a free Statsig account.
- Navigate to the Statsig integration page and enable the RevenueCat integration.
- Navigate to the Statsig API Key page and copy your Server Secret Key.
On RevenueCat:
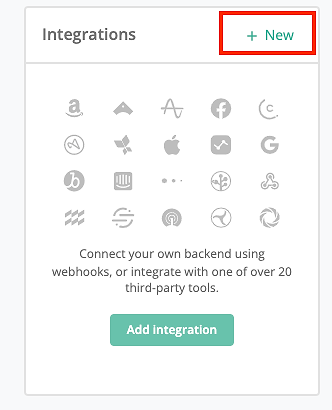
- Navigate to your project in the RevenueCat dashboard and find the Integrations card in the left menu. Select + New.
- Choose Statsig from the Integrations menu.
- Paste the Server Secret Key copied from the Statsig console.
Once you’ve completed these steps, you’ll start seeing events from RevenueCat appear in your Statsig metrics page.
For more help setting up the integration between RevenueCat and Statsig, see the documentation here.
Run Your First A/B Test
Setting up an A/B test with Statsig is easy:
- Install the Statsig SDK for the language or framework you use. (For example, Javascript.)
- Create a new feature gate in the Statsig console. (For help with this step, check out the Statsig docs).
- Add targeting for your gate to specify which users should receive the new experience. (For example, you could specify that 50% of your Android users see the variation.)
- Add the code that initializes the Statsig SDK.
- Add the code that modifies your app’s experience based on whether the user passes the gate or not.
Once you’ve implemented this code, Statsig will start running an A/B test, automatically comparing users that pass the gate with those that don’t. The user IDs from the Statsig SDK are then combined with the events coming in from RevenueCat, allowing Statsig to provide insights into how your experiment is affecting your growth and revenue.
After a few days of running your A/B test, you’ll be able to see data like this in the Pulse Results section of the gate you created.
Conclusion
Statsig helps you run A/B tests on every feature you develop so you can learn how those features affect your users. These insights can give you confidence that the changes you’re making are good for your product and users, and help guide your decisions for future development.
Start using Statsig for free today, and integrate with RevenueCat to optimize your engagement and revenue.